Aging and Exercise
Have we been aging too quickly?
 How can some people keep up with the sports and activities they enjoy later in life, while others reach a point where they can't move the way they used to?
Did you know that 75-year-old athletes can have the same fitness level as teenagers who don’t exercise? Imagine your grandpa being able to keep pace with you as you jog around the park!
Science has identified trends in physical performance and genuine changes in the body that occur with aging, but what explains the differences we see from person to person?
The Science Of Aging And Exercise
Maximum strength, cardio fitness, balance, and muscle endurance studies show that physical ability steadily declines from young adulthood through retirement and advanced age, with the rate of decline increasing after middle age.
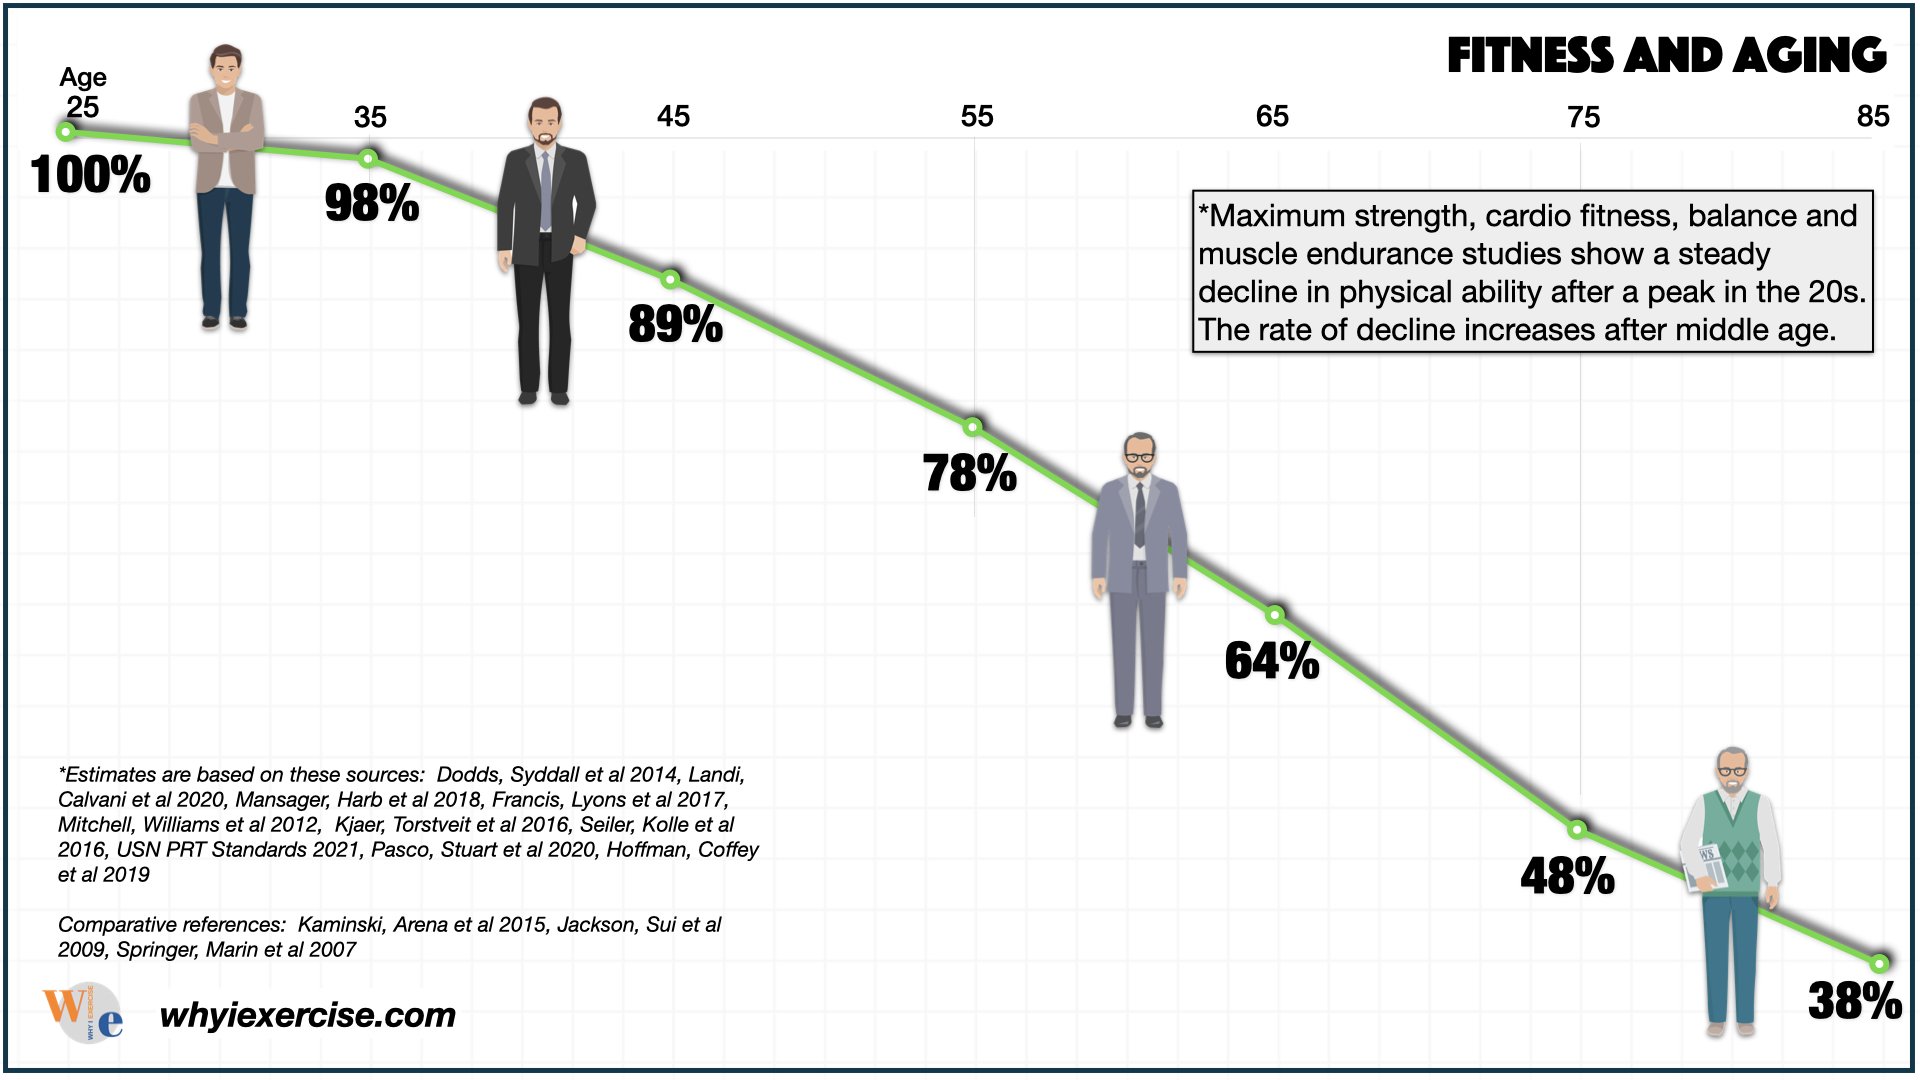 Average fitness and physical ability levels decline beginning in the 30s.
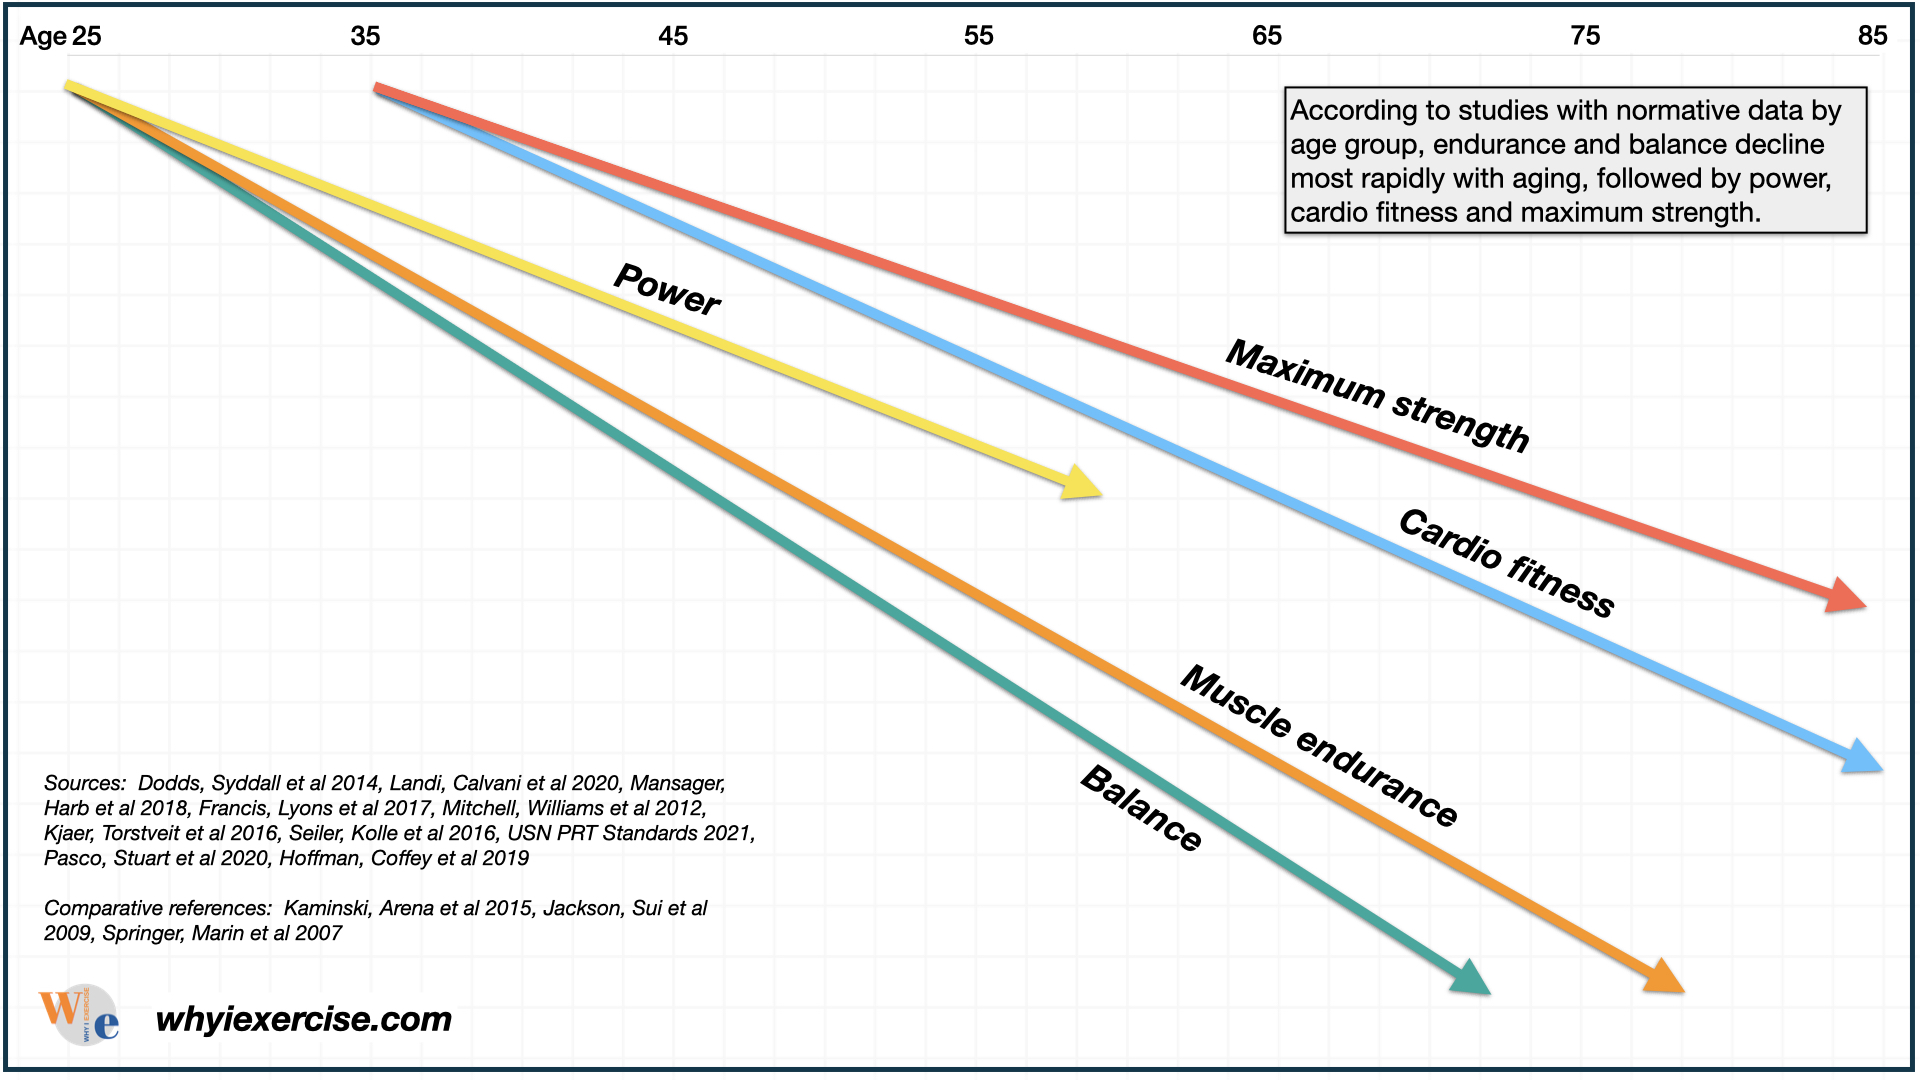 Balance and muscle endurance decline with aging more rapidly than maximum strength and cardio fitness.
According to studies with normative data by age group, muscle endurance, and balance are lost most rapidly with aging, followed by power, cardio fitness, and maximum strength (1-10). However, the graphs represent averages--there can be large differences between individuals.
So how much of this decline is unavoidable, and how much is due to lack of exercise?
How Much Can We Affect Aging By Exercising?
Studies have also uncovered internal aging changes in all body systems that are apparently occurring regardless of a person's fitness or activity level. Tendons lose stiffness, muscle fibers shrink, and muscle mass declines by 4-5% per decade.
Aging is connected to changes in the nervous system. Brain cells that affect motor control become less responsive. Slow-twitch endurance neurons replace fast-twitch nerve cells.
There is also less space for blood flow in the heart and blood vessels, smaller air sacs in the lungs, and less elasticity in the heart valves and lung tissue (17-20). With all this verifiable evidence, how do some people defy the odds?
Be inspired by remarkable aging and exercise success stories in this YouTube video from Why I Exercise.
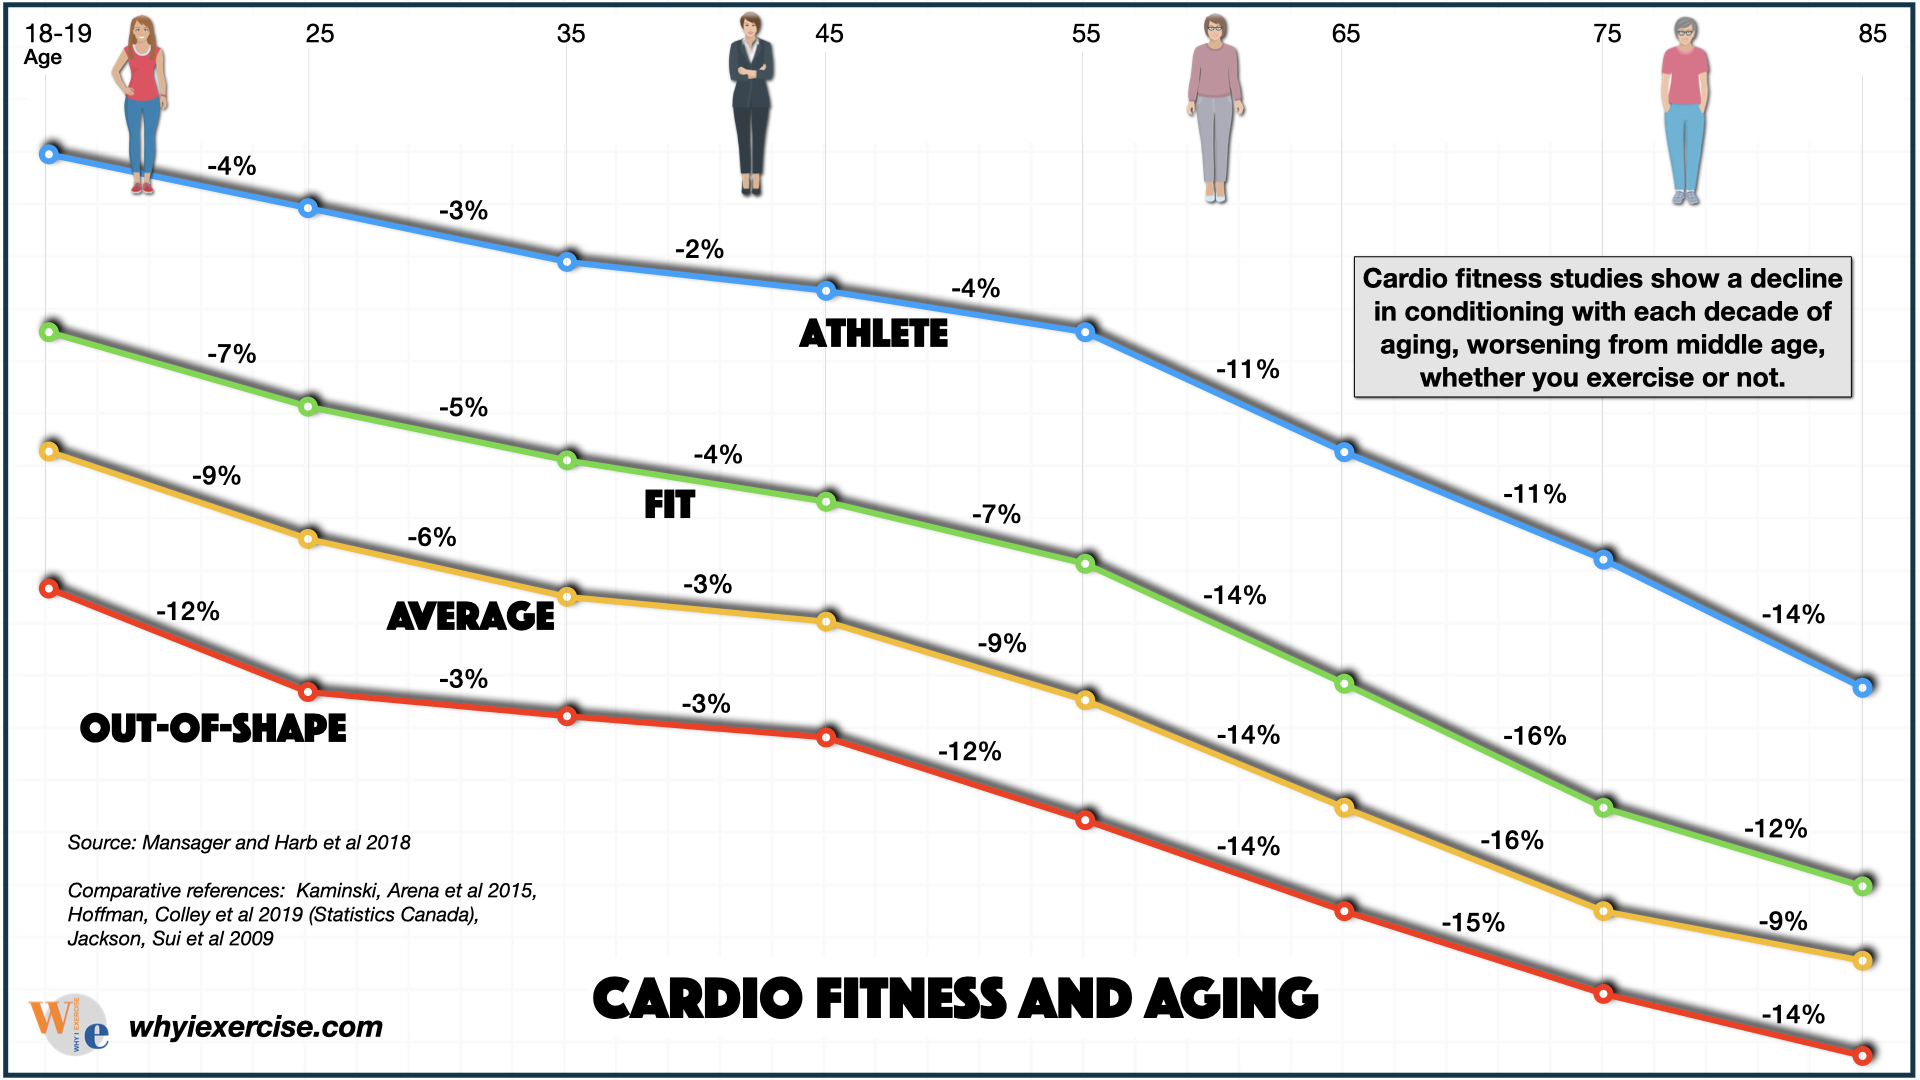 If we compare athletic and fit people with out-of-shape peers, we can see the age-related decline in fitness is very similar in both groups.
Are age-related changes in the body set in stone whether or not we exercise? How much difference does it make to stay active as we get older?
If we look closely at the data, we see that active and athletic people in their 40s, 50s, and 60s have similar conditioning as young adults.
It's possible to maintain this youth-like advantage through the retirement years. This is based on a 23-year Cleveland Clinic study that followed over 120,000 people! (3)
Here are some fun comparisons from the data for men. A fit teen has the same conditioning as an athlete in his 50s. A fit 55-year-old is better than an average 35-year-old. An out-of-shape 55-year-old is not quite as fit as an average 65-year-old or a fit 75-year-old.
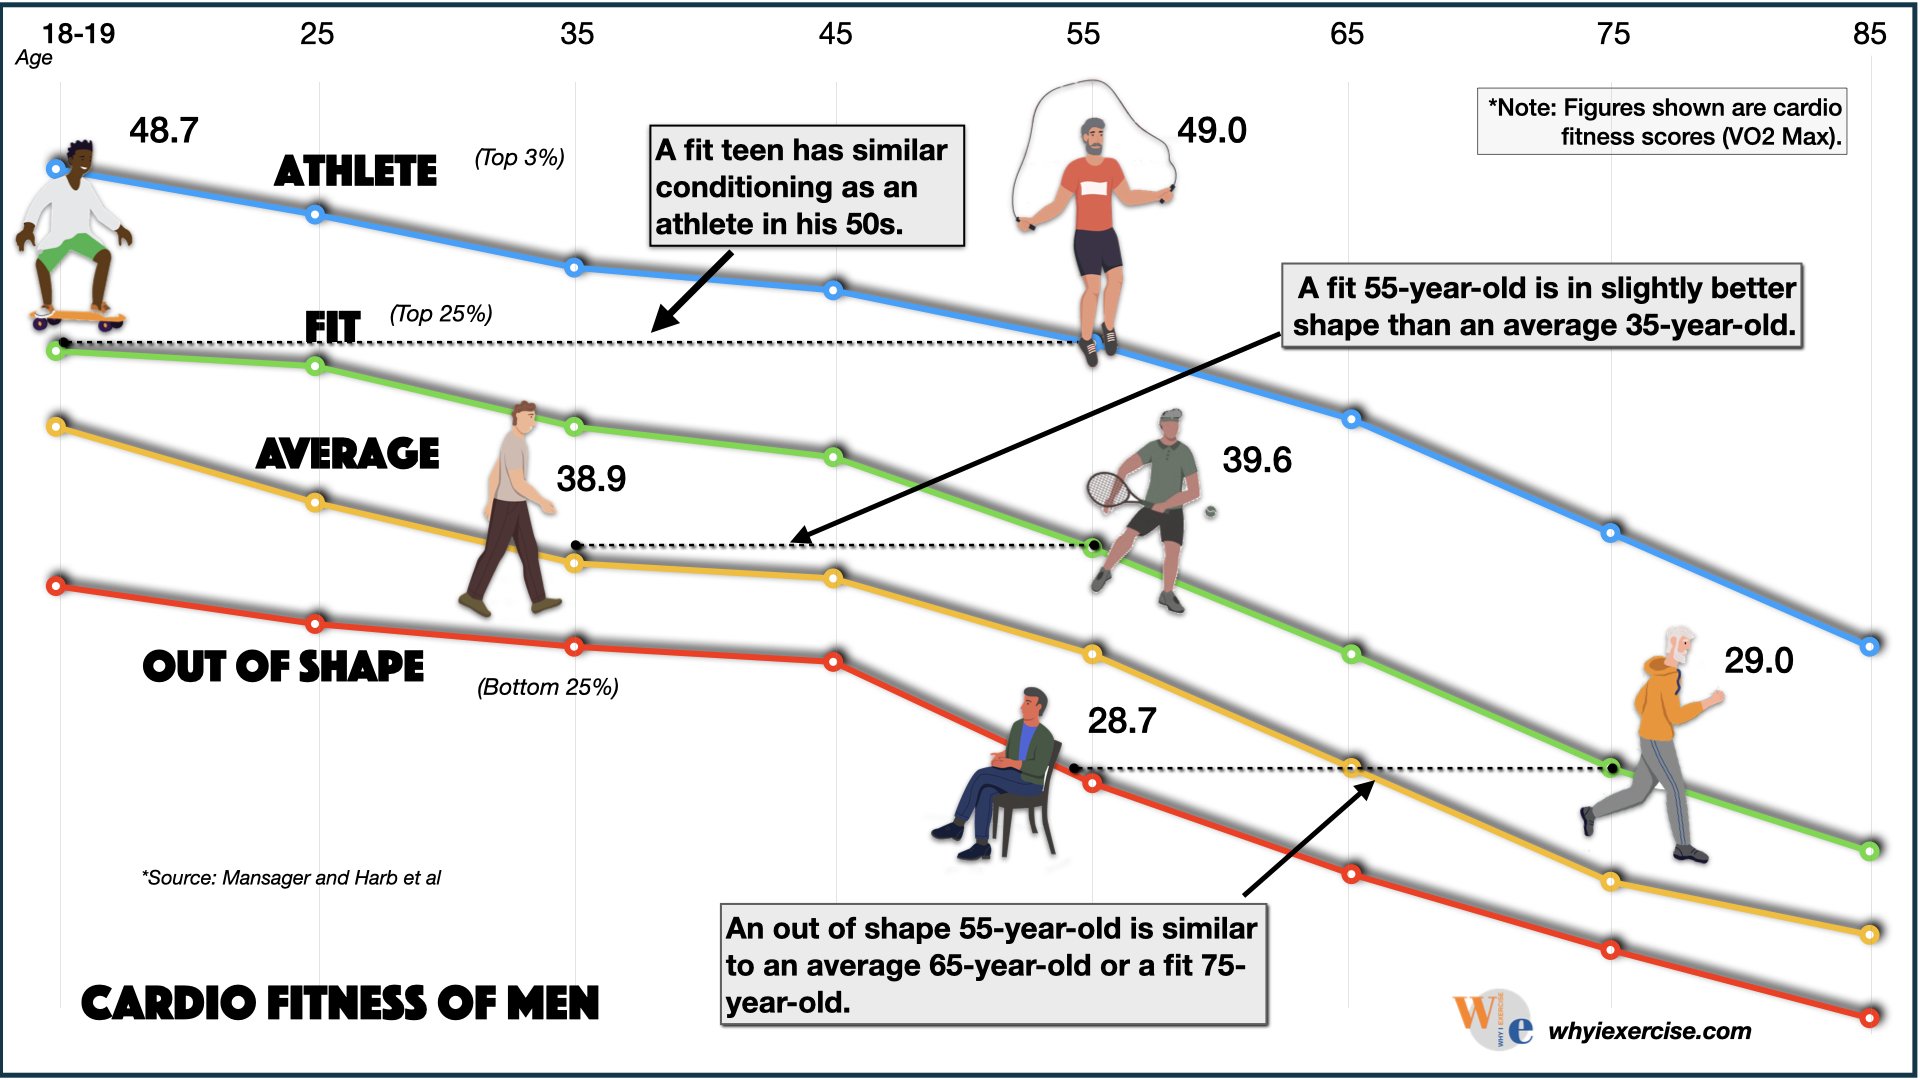 Fit and athletic middle-aged and senior men can have similar athletic abilities as people 20 or more years younger.
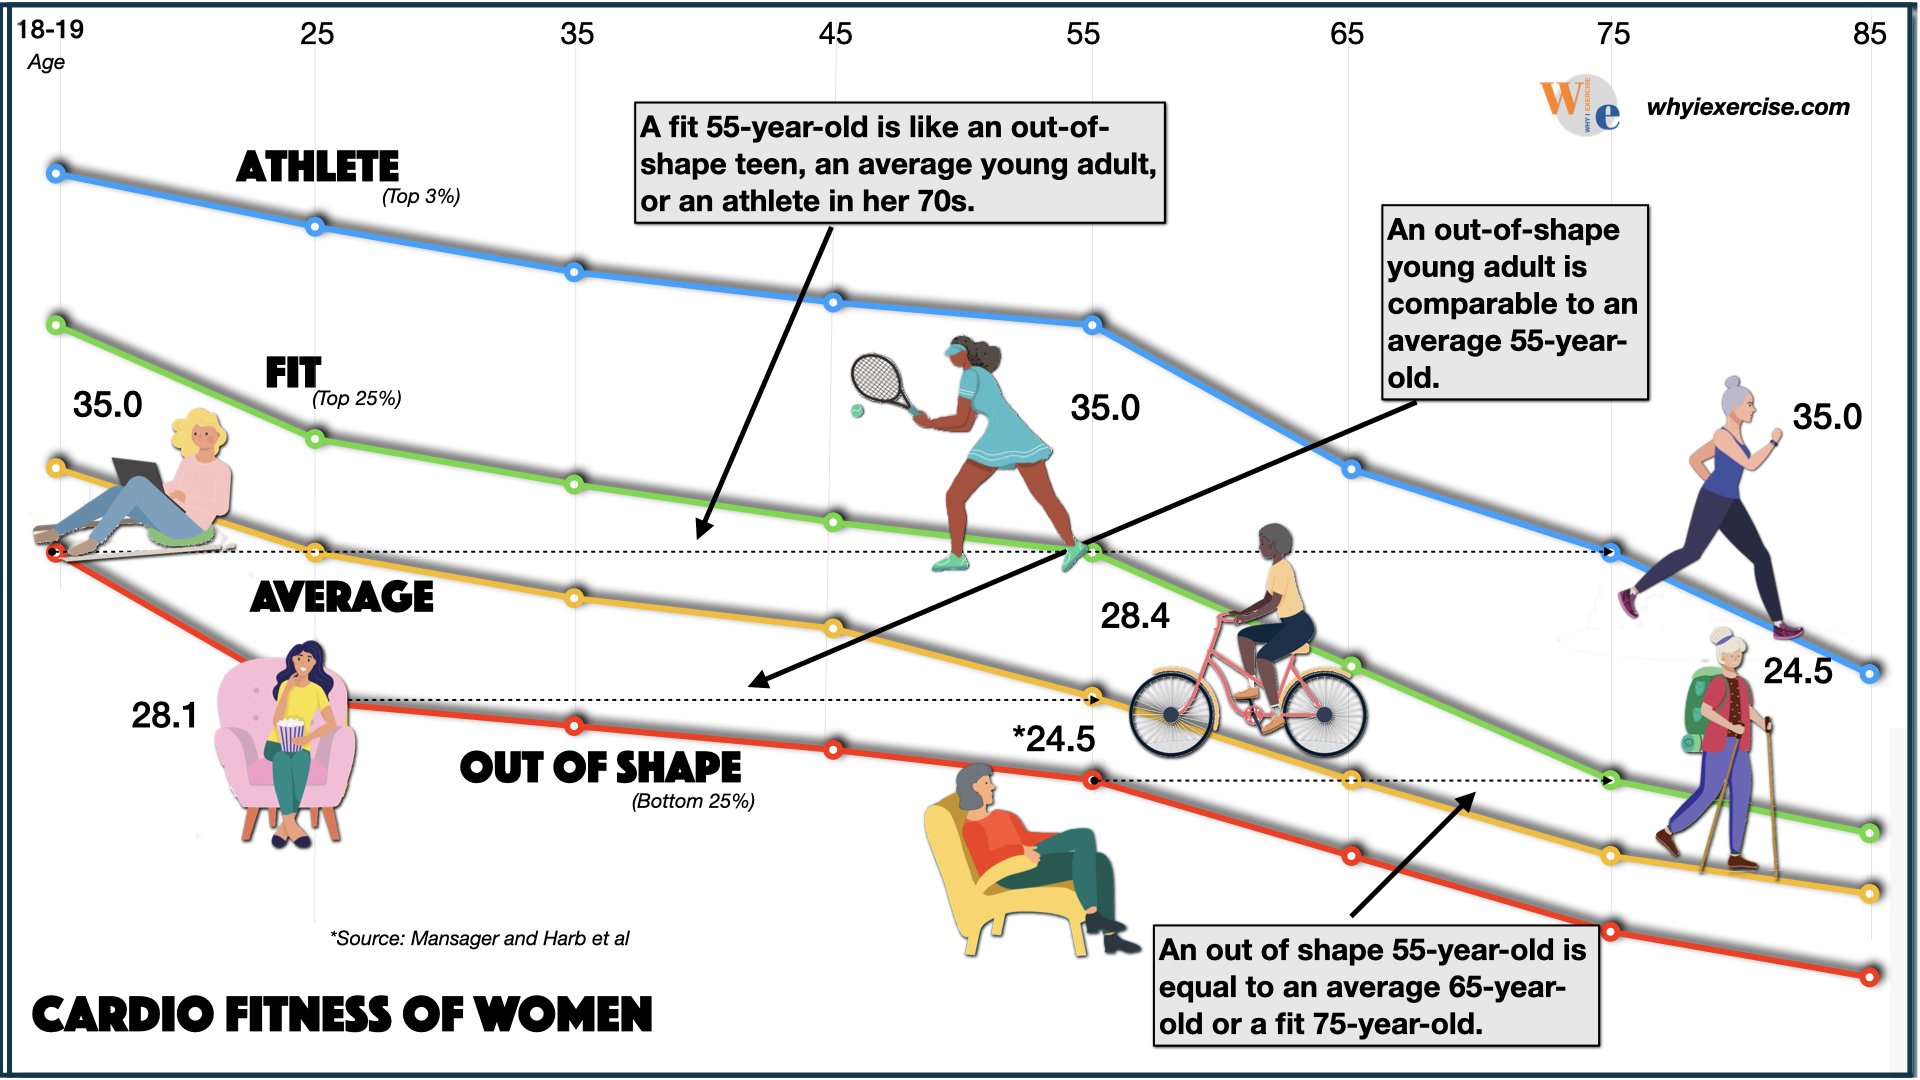 Active middle-aged and senior women have the same advantages over their inactive peers.
When we look at women, we find that a fit 55-year-old is like an out-of-shape teen, an average young adult, or an athlete in her 70s. An out-of-shape young adult is comparable to an average 55-year-old. An out-of-shape 55-year-old is equal to an average 65-year-old or a fit 75-year-old.
So the most profound observation from the decline that comes with aging is that people who stay active have a considerable advantage over their out-of-shape peers.
Aging and exercise: Healthy Aging success Stories
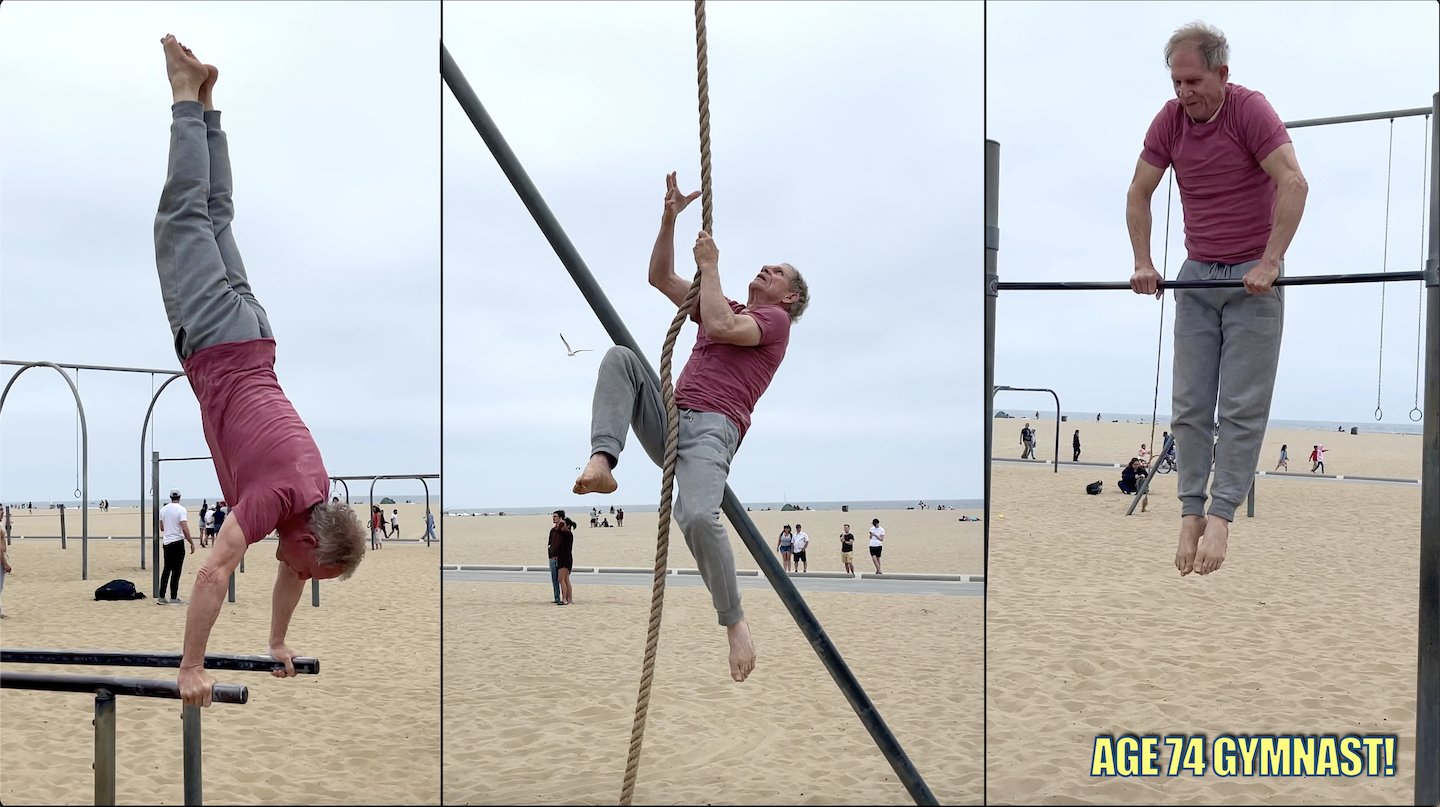
Kim Goodwin can 'fly' at age 74!
At age 74, Kim Goodwin is (in many ways) stronger and more athletic than most young adults. He can do over 20 pull-ups, climb a 25-foot rope without using his feet, swing into a handstand on parallel bars, and perform acrobatic maneuvers on gymnastics rings, among other abilities!
Kim has been able to stay healthy and keep up with his training for decades by exercising consistently, warming up thoroughly, listening to his body, stretching often, and training with his friends to stay motivated.
Kim returned to gymnastics at age 40 after a 20-year break while serving in the military and starting his family. 60-year-old gymnasts inspired Kim to regain the strength he had in high school.
After six years of training with them, Kim matched his rope climbing record from high school and his all-time best number of pull-ups (33) at age 46!
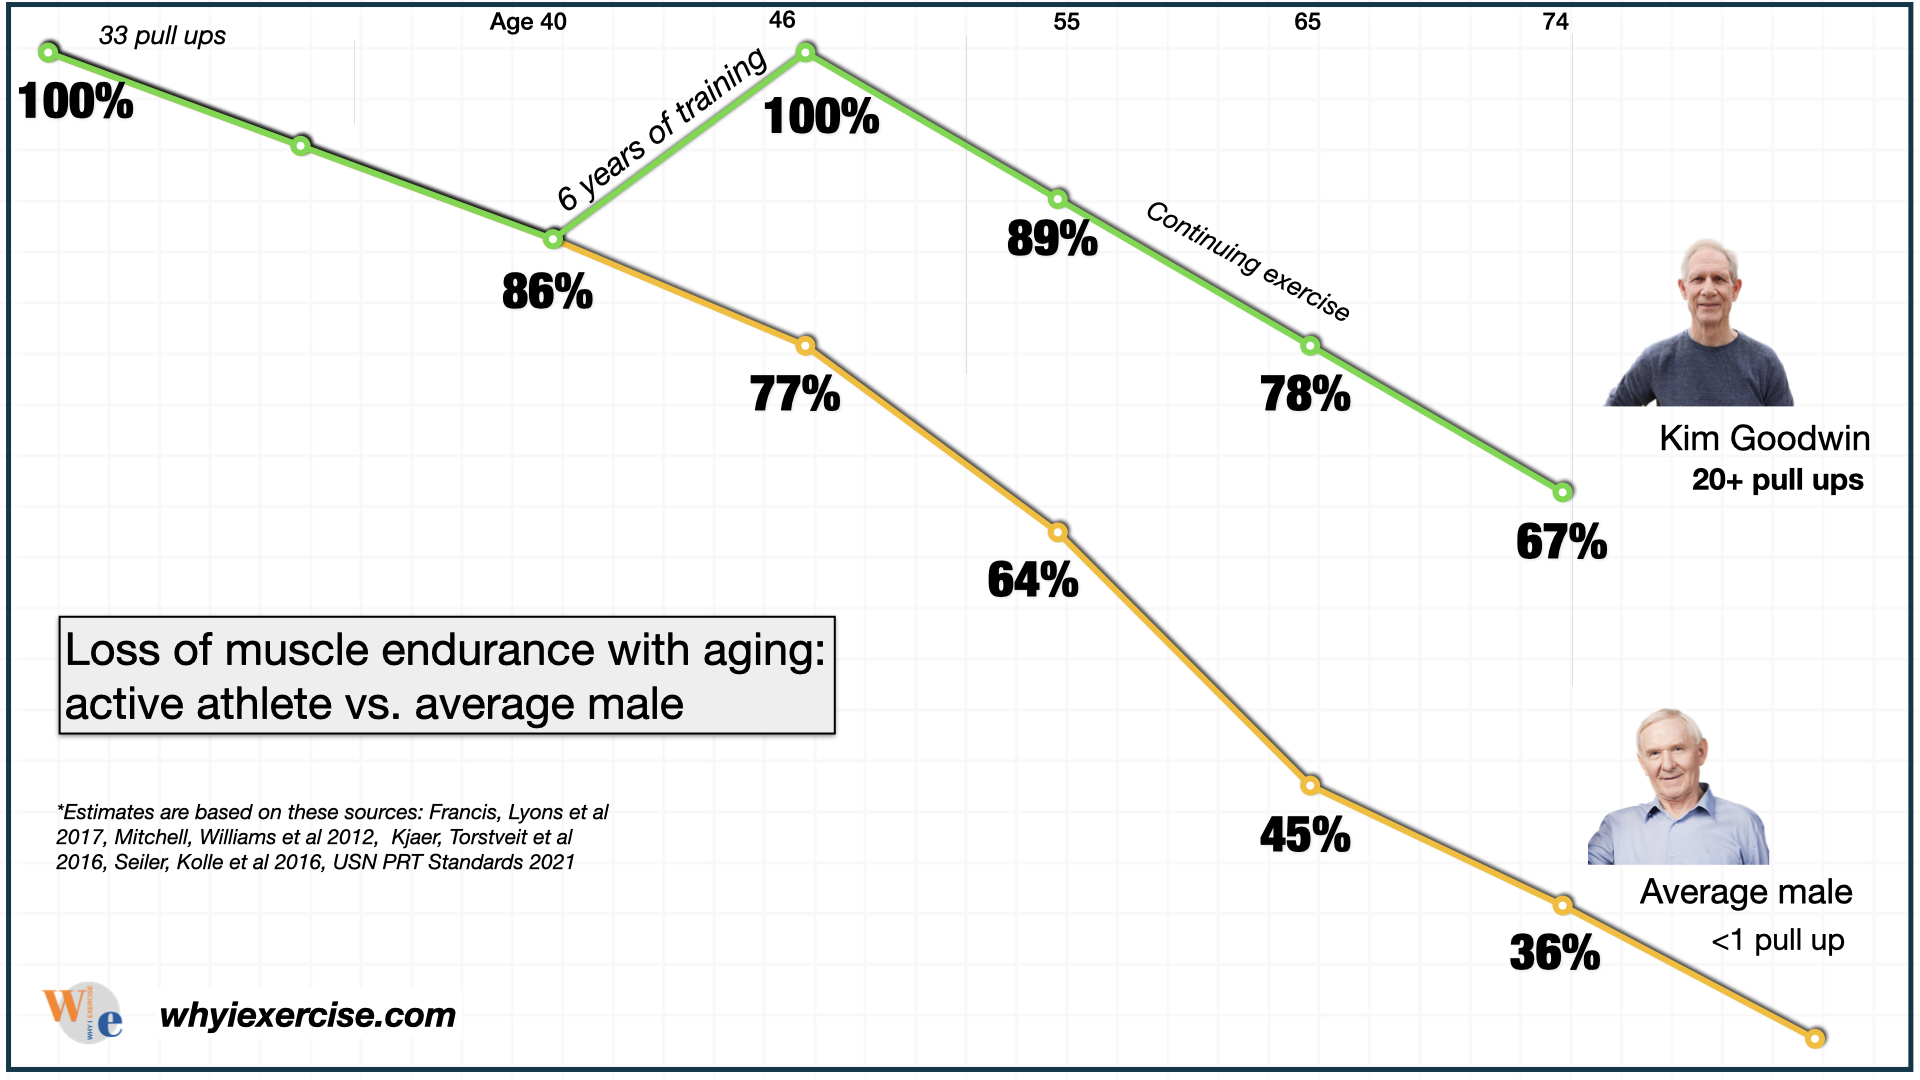 Though he has experienced some decline since middle age, Kim maintains exceptional strength to this day, with outstanding physical ability compared to his peers.
Eric Schreiber became a top senior marathoner!
At the age of 63, Eric Schreiber wasn’t feeling healthy. He was active in the past, but he slowed down and gained weight since then. Eric knew it was time for a change after feeling exhausted from a mile-and-a-half walk. He trained for seven years and then won his age group in the Akron Marathon two times, among other awards. Since then, Eric has competed in four events in the National Senior Games.
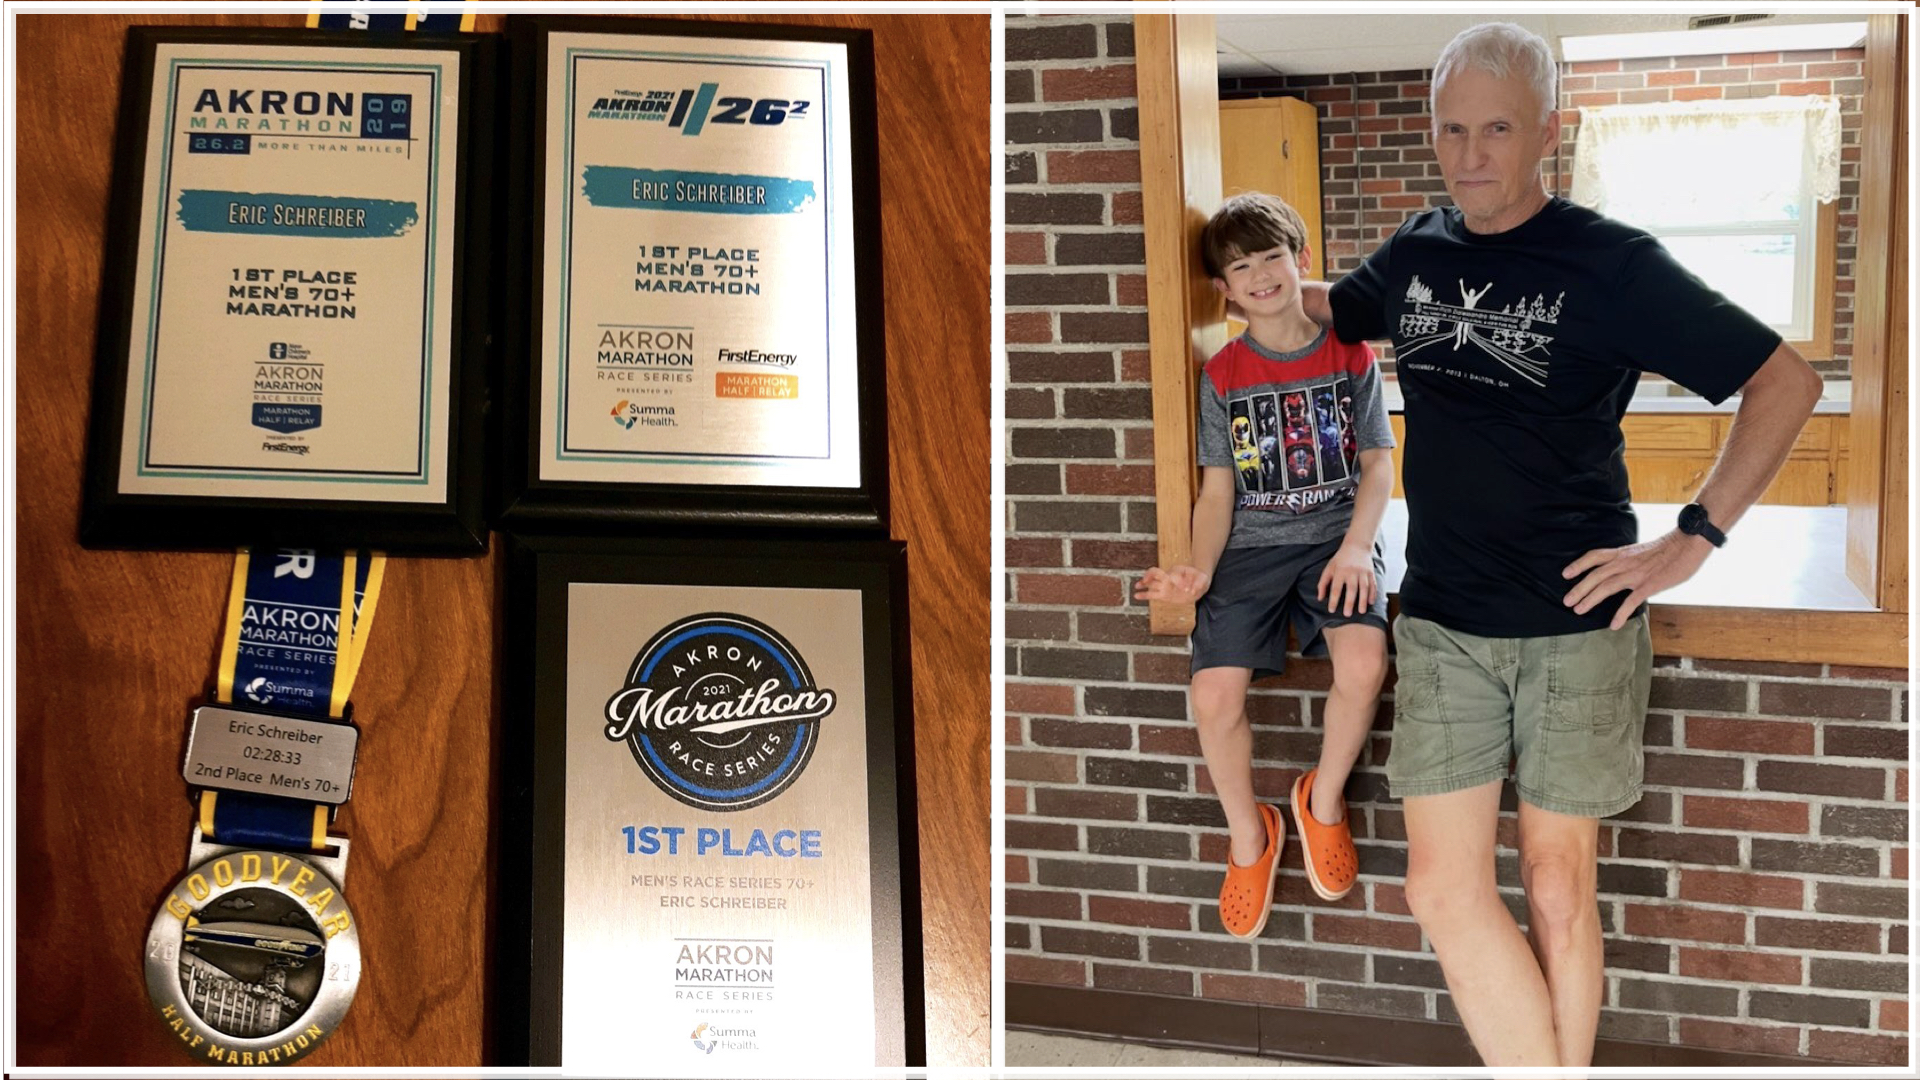 Starting at age 63, Eric's training allowed him to become a locally competitive athlete!
Now he’s fast enough to race against his great-nephew (10 yr old)! Today, at 73 years old, Eric plans to keep running as long as he can. As he says, “I don’t want to get old!”
As with Kim Goodwin's experience in middle age, Eric made a big turnaround after years of effort, but what do the changes with aging and exercise look like for the average person?
Aging and Exercise: Fitness Performance & strength by age
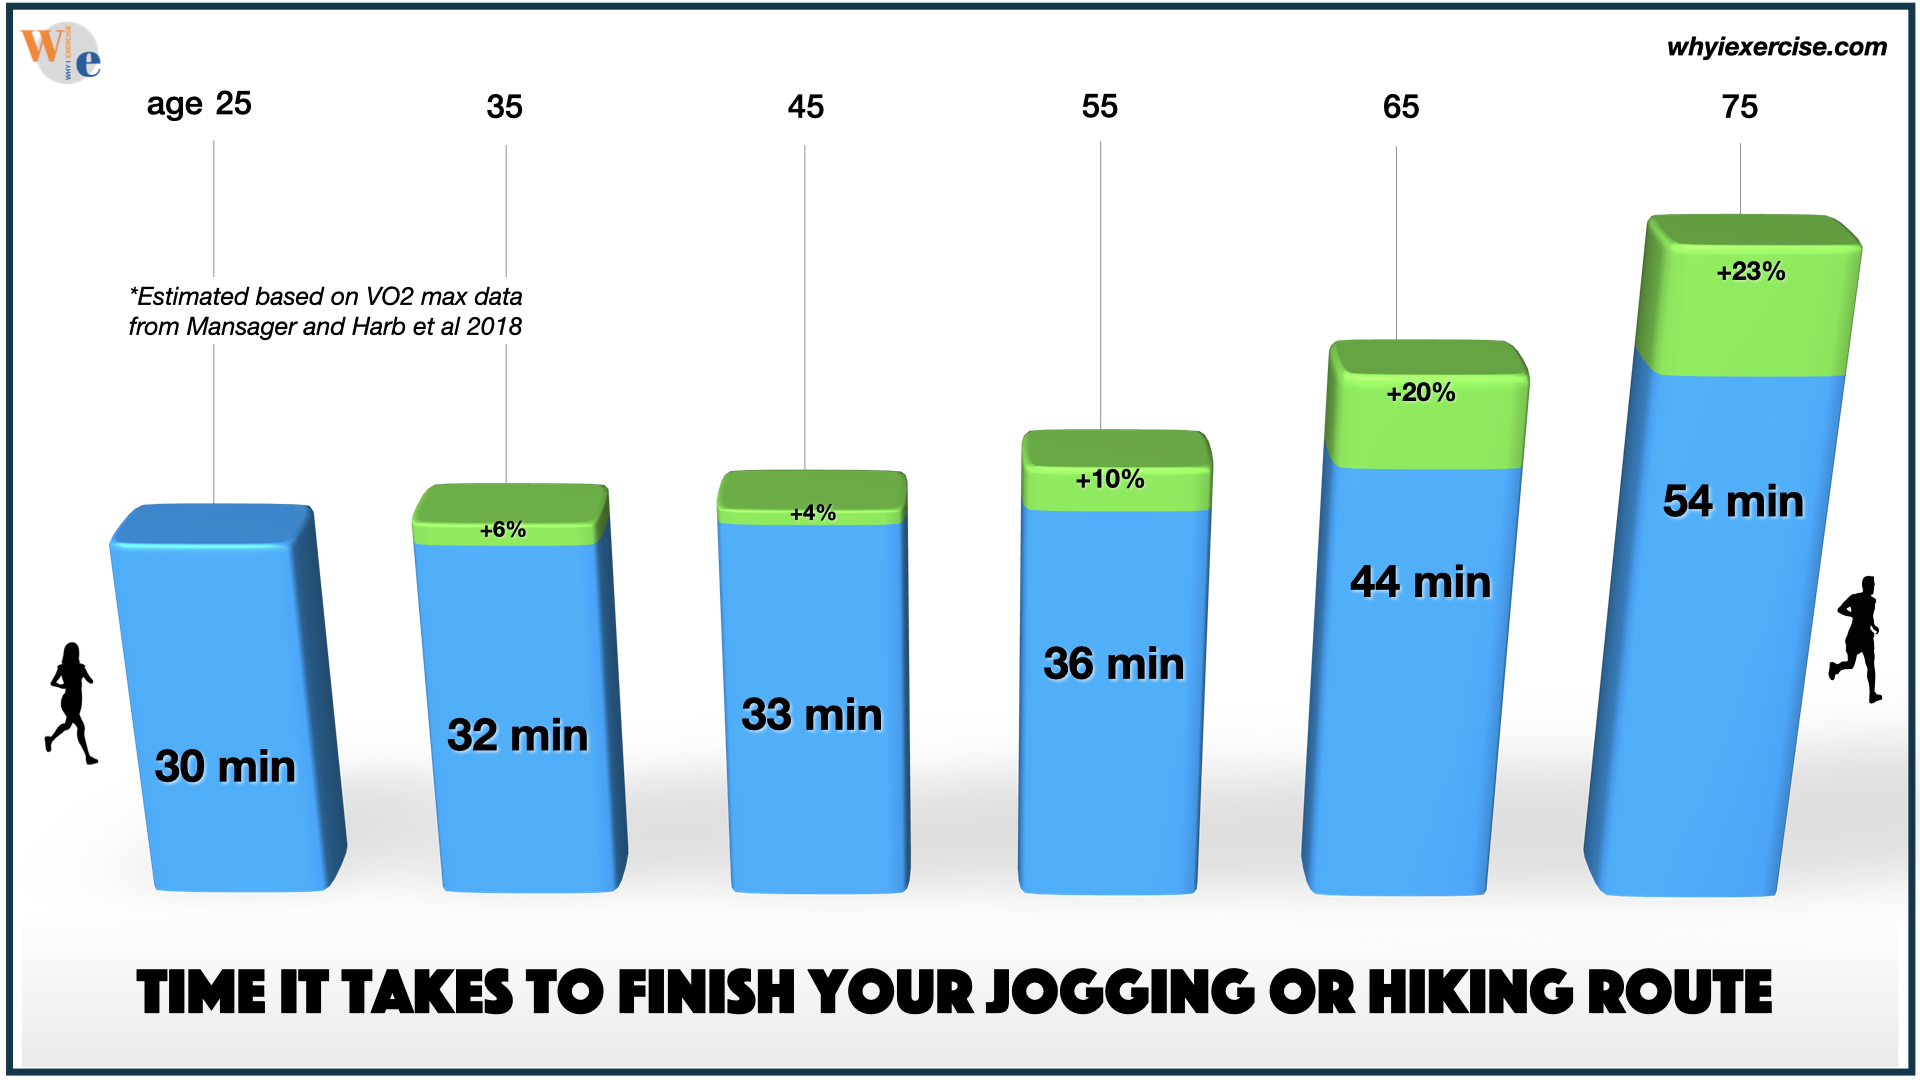 The actual decline in fitness with aging may be more gradual than you imagined.
Suppose you have a running, hiking, or biking route that takes you 30 minutes to finish at age 25. If you keep up with a similar weekly exercise routine over the next 20 years, it will take you only three more minutes to finish.
By age 65, if you are gradually slowing down your activity as the average person would, and provided you have no remarkable life changes, it will take you 44 minutes to complete your route. Then at 75, after a 40% overall decline in your cardio fitness, it will take you about 54 minutes to finish (3).
When it comes to strength and aging, suppose you use 100# for a weightlifting exercise at age 25. If you gradually adjust your lifestyle over time, as the average person would do, you would expect to lift 90# at age 45, 70# at 65, and 45# at 85, giving you a 55% decline over 60 years (1, 2, 4, 6, 9).
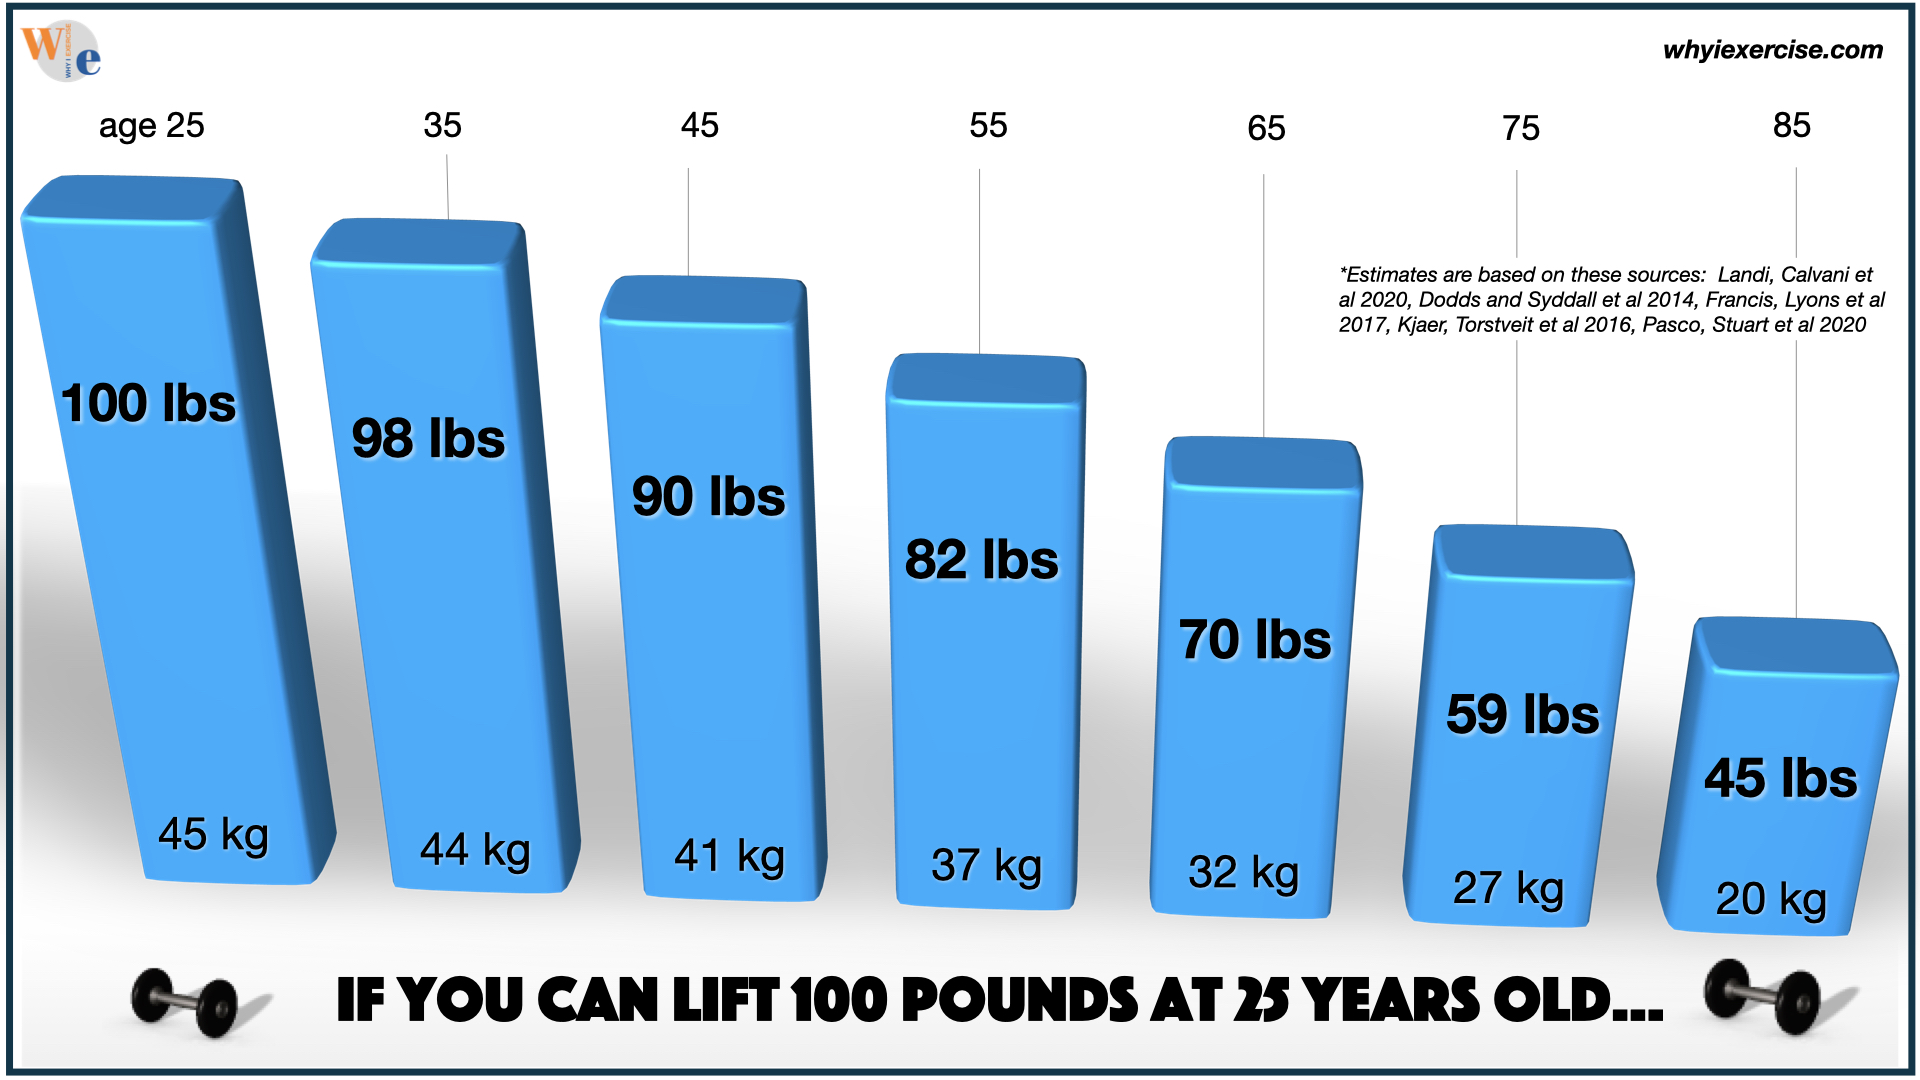 While the average decline in strength with aging is proven, it's possible to get stronger, even late in life.
How does your fitness compare to your age-group peers?
stronger & faster through the 60s & 70s! Can Exercise Reverse Aging?
|
When it comes to aging and exercise, averages aren’t for everyone. Some exceptional athletes seem to defy the limits of the aging decline. John Moore was able to bench press 270 pounds as an 81-year-old! After 41 years away from the sport, John started weight lifting again at the age of 66. For the next 12 years, at a time in life when he should have been losing strength, he lifted more weight every year. |
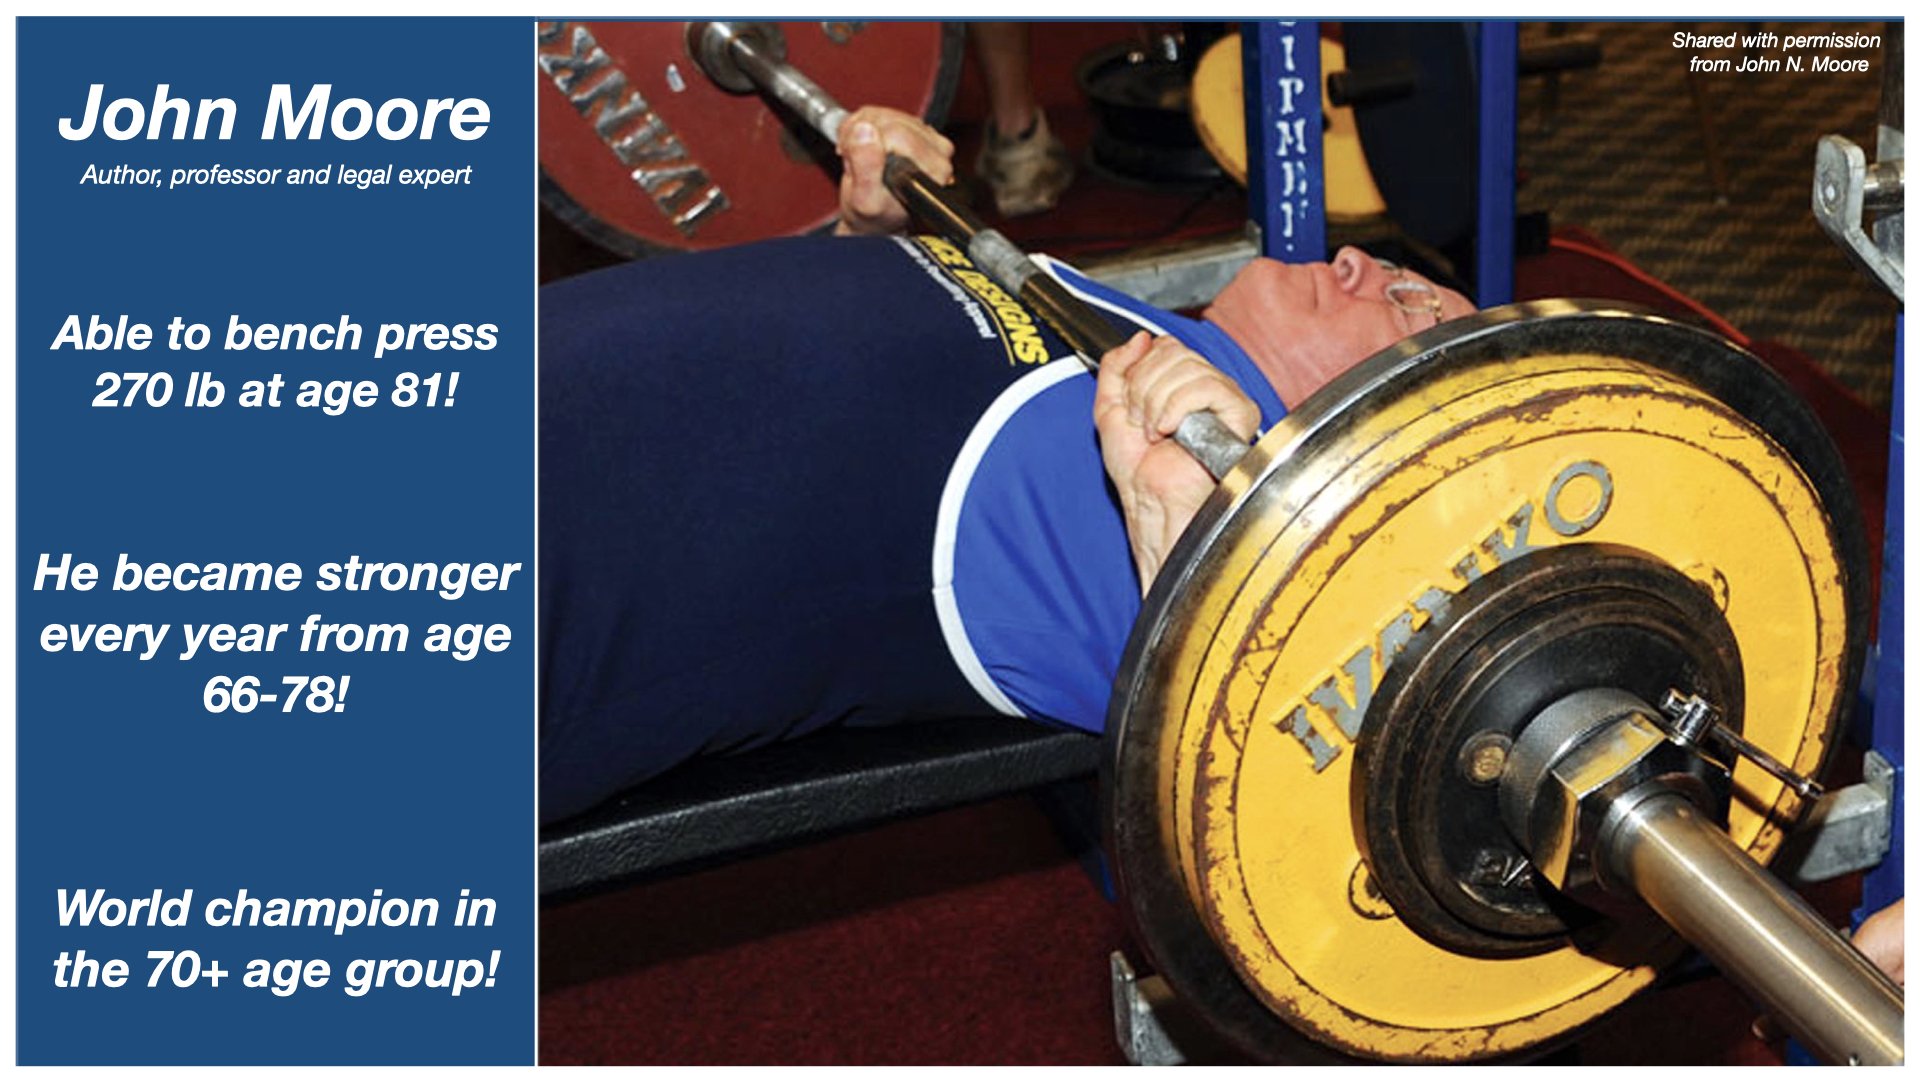 John Moore won the powerlifting world championship for the bench press in the 70+ age group in 2019. John Moore won the powerlifting world championship for the bench press in the 70+ age group in 2019. |
Jeannie Rice is the world record holder in the marathon for her age group. At age 73, she ran faster than 8 minutes per mile for an entire marathon, which is much better than an average marathoner of any age!
Jeannie was running marathons in 3:40 ten years prior, and her recent effort improved to 3:24. By age 75, Jeannie set three new world age group records running in 1500, 5000, and 10000-meter championship (USATF) races. She ran 10,000 meters in 46:53. This is 7:33 per mile and over three minutes faster than the previous record.
Just like John and Eric, Jeannie improved her physical ability much later in life than we would expect. They are all amazing examples when it comes to aging and exercise.
John and Eric show that previously active people can make a big comeback, even in their 60s and 70s, while Jeannie shows it’s possible to continue improving, even for people who already have outstanding fitness.
aging and exercise Research Reveals a widening Gap in old Age
While these athletes are performing remarkably well, many peers reaching this age are on the cusp of disability. Data from WHO anticipates that the average 60-year-old will lose physical independence by the late 70s, even in the top-20 countries for life expectancy(11).
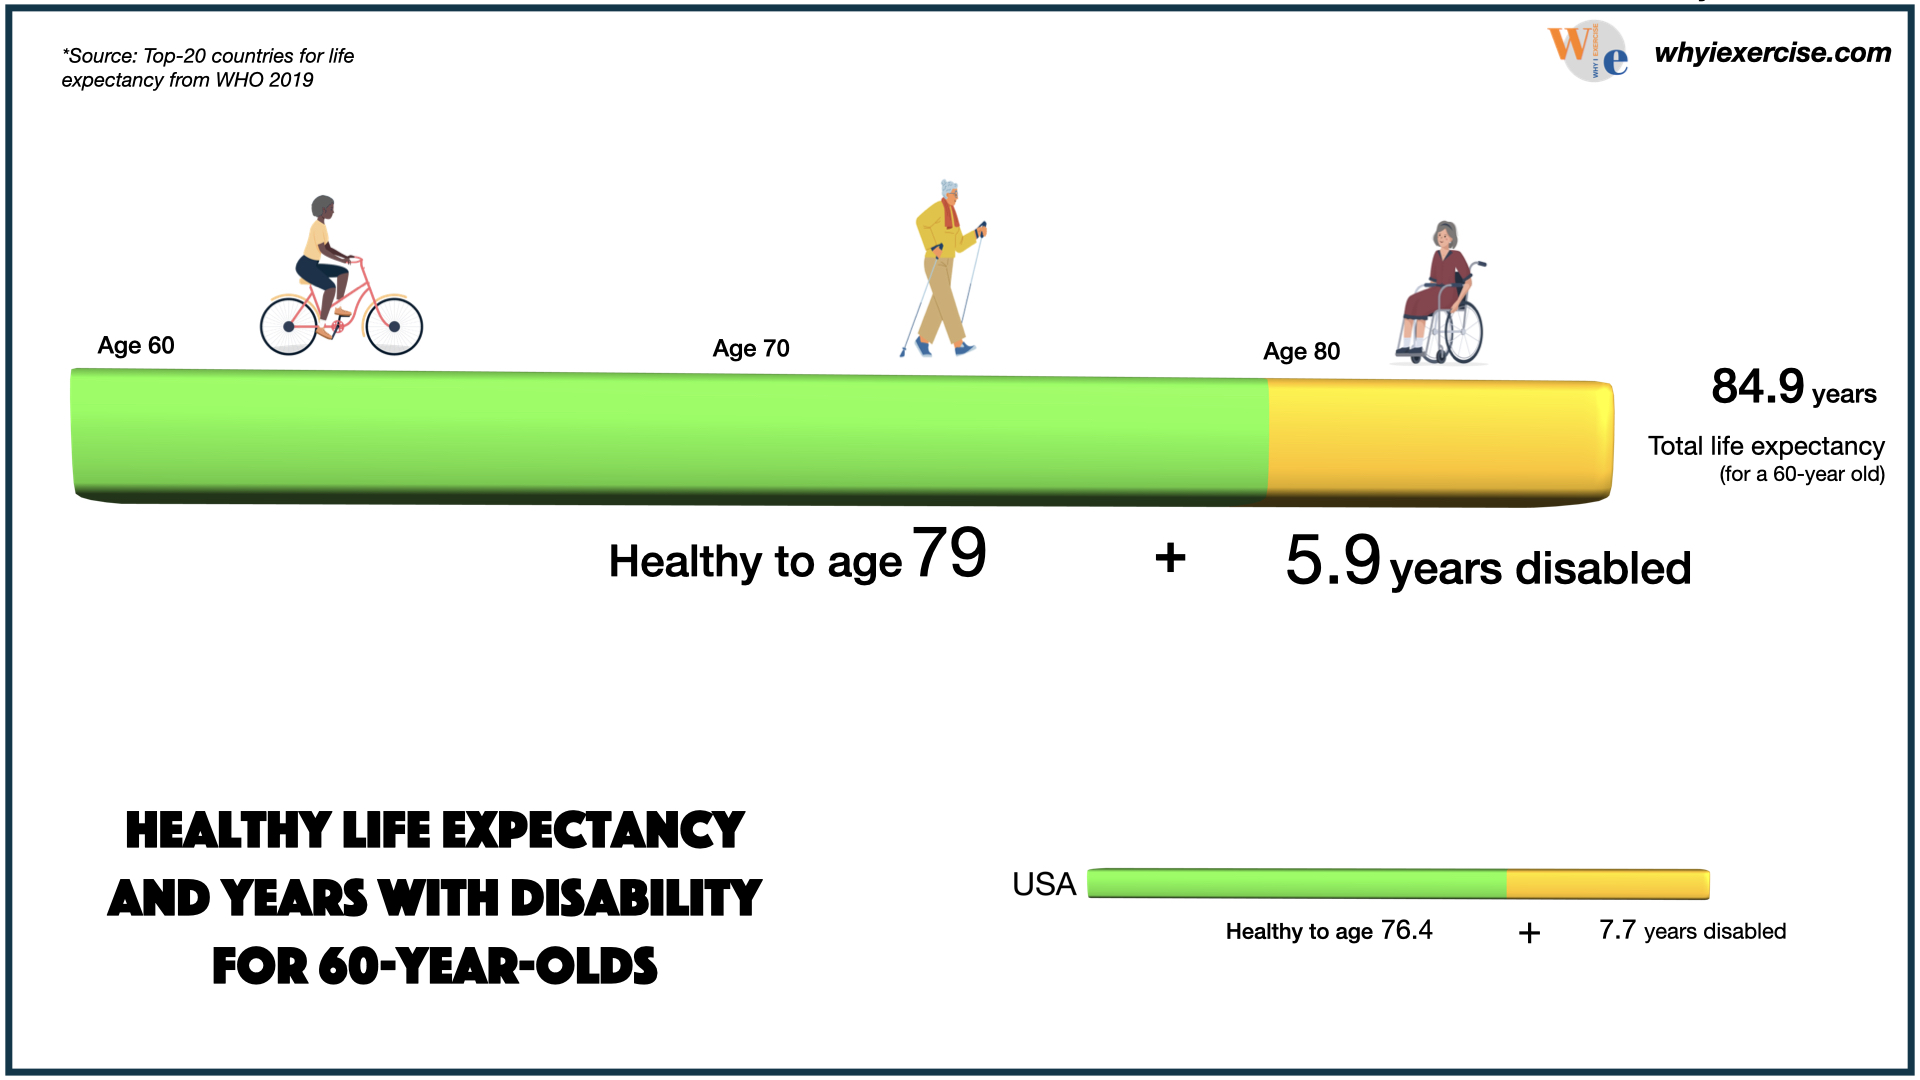 The average senior has some level of dependence on others for 6 years before the end of life. US seniors experience nearly 8 years of disability.
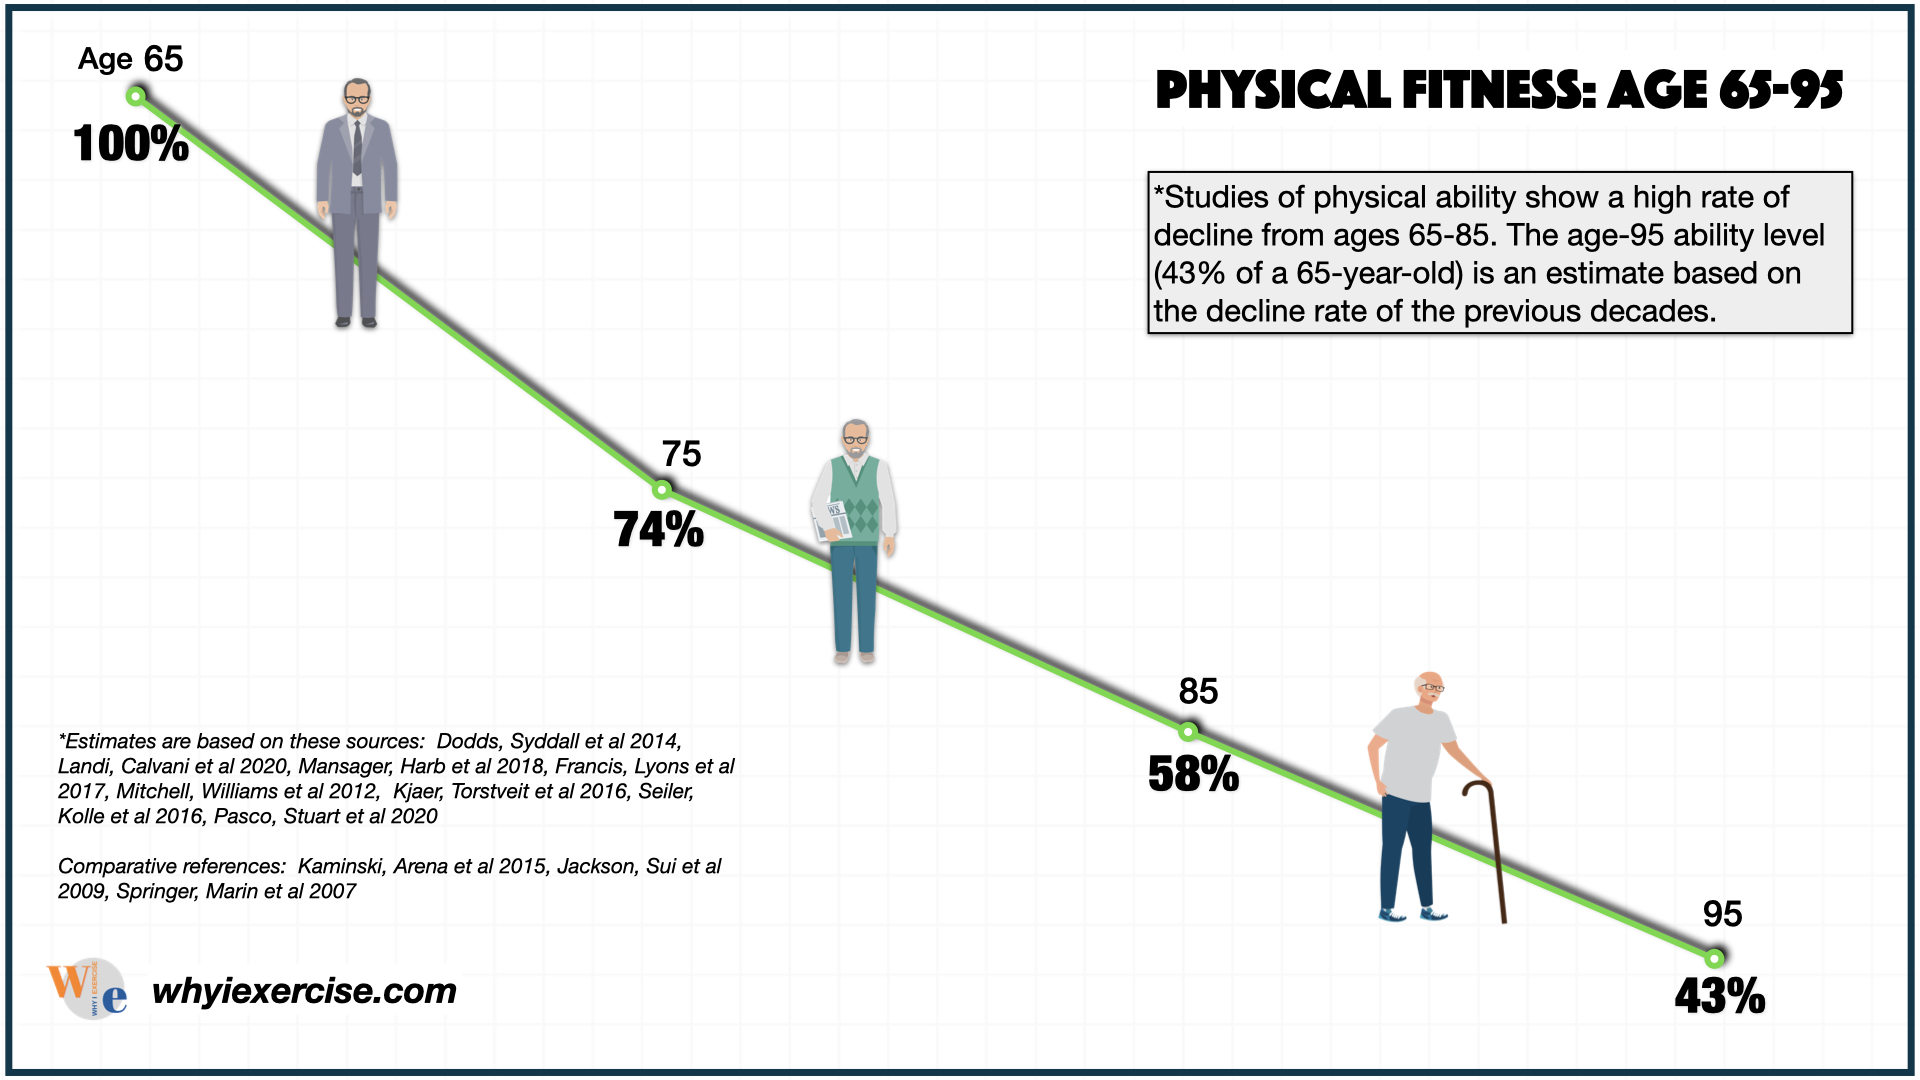 Balance tends to decline aggressively in old age, followed by muscle endurance, maximum strength, and cardio fitness.
For those who live to the 90s, walking rates tend to slow down significantly, and there is much more walker and wheelchair use compared to people in the 70s and 80s.
Studies of physical ability show a high rate of decline from ages 65-85. The age-95 ability level is 43% of a 65-year-old.
The rating is an estimate based on the decline rate of the previous decades (1-10).
It’s possible to make improvements in your senior years, especially for people who were active earlier in life. But with the general trend of decline after 65, we are best off building our fitness up before retirement as well.
The quality of life advantage for active seniors is unmistakable compared to their peers, as there are seniors over 100 competing in athletics and 110-year-olds still walking on their own. With the widening gap in life outcomes as we grow older, how can we give ourselves the best chance at successful aging?
Assess your progress with aging and exercise
Thanks to advances in health science, fitness tests have become a good health indicator and a guide for your future exercise training.
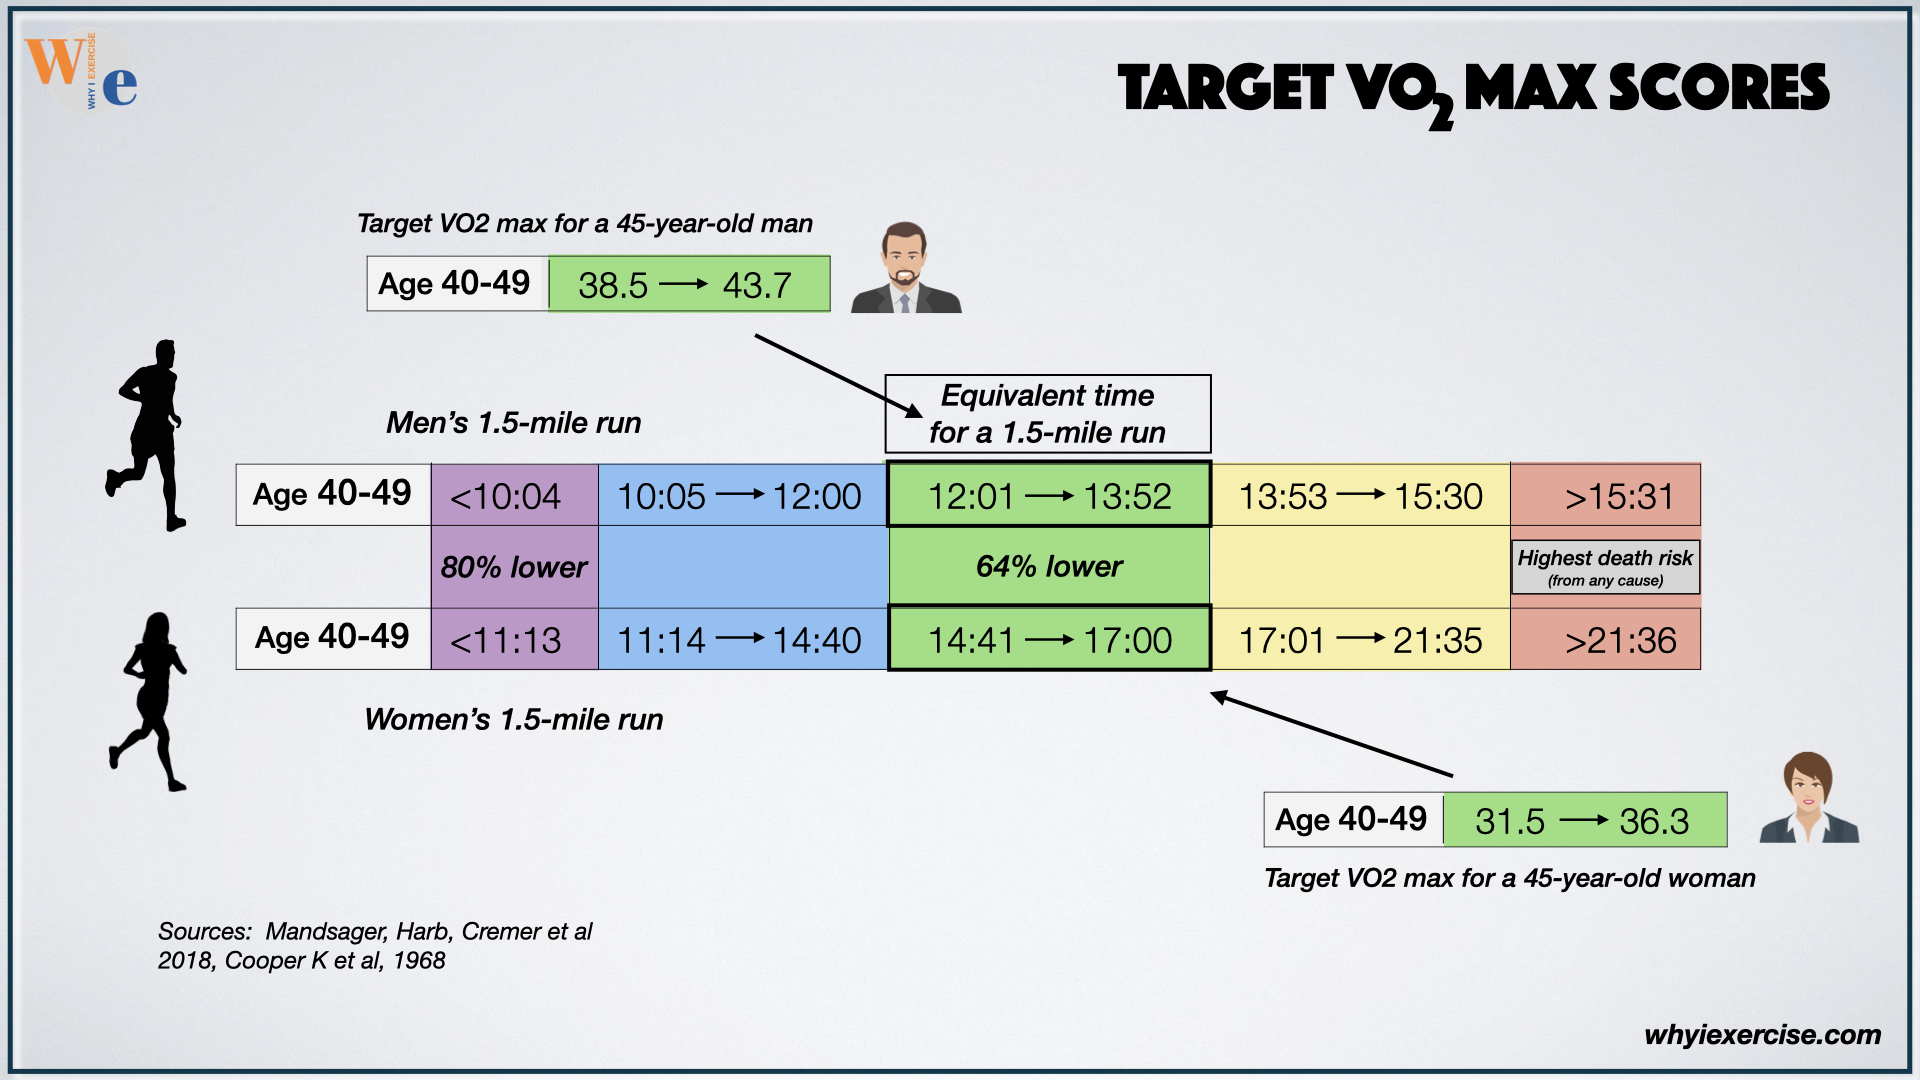
You can self-test your cardio fitness, or VO2 max, with a 1-mile walk or a 1.5-mile run for time. Using data from current research, the minimum fitness standard for a 45-year-old woman would be the equivalent of running 1.5 miles in 17 minutes or better.
For a man the same age, it would be 13:52 or better.
With aging, muscle endurance declines faster than cardio fitness. Fortunately, there is meaningful data you can use to track your status.
A 2019 Harvard study found that working-age men who could do at least 11 push-ups were much less likely to develop heart disease than those who could do ten or fewer. Risks decreased further at 21 push-ups and above.
These numbers compare closely with established fitness standards for pushups. Are you in the low-risk group, or do you need to build up your muscle endurance?
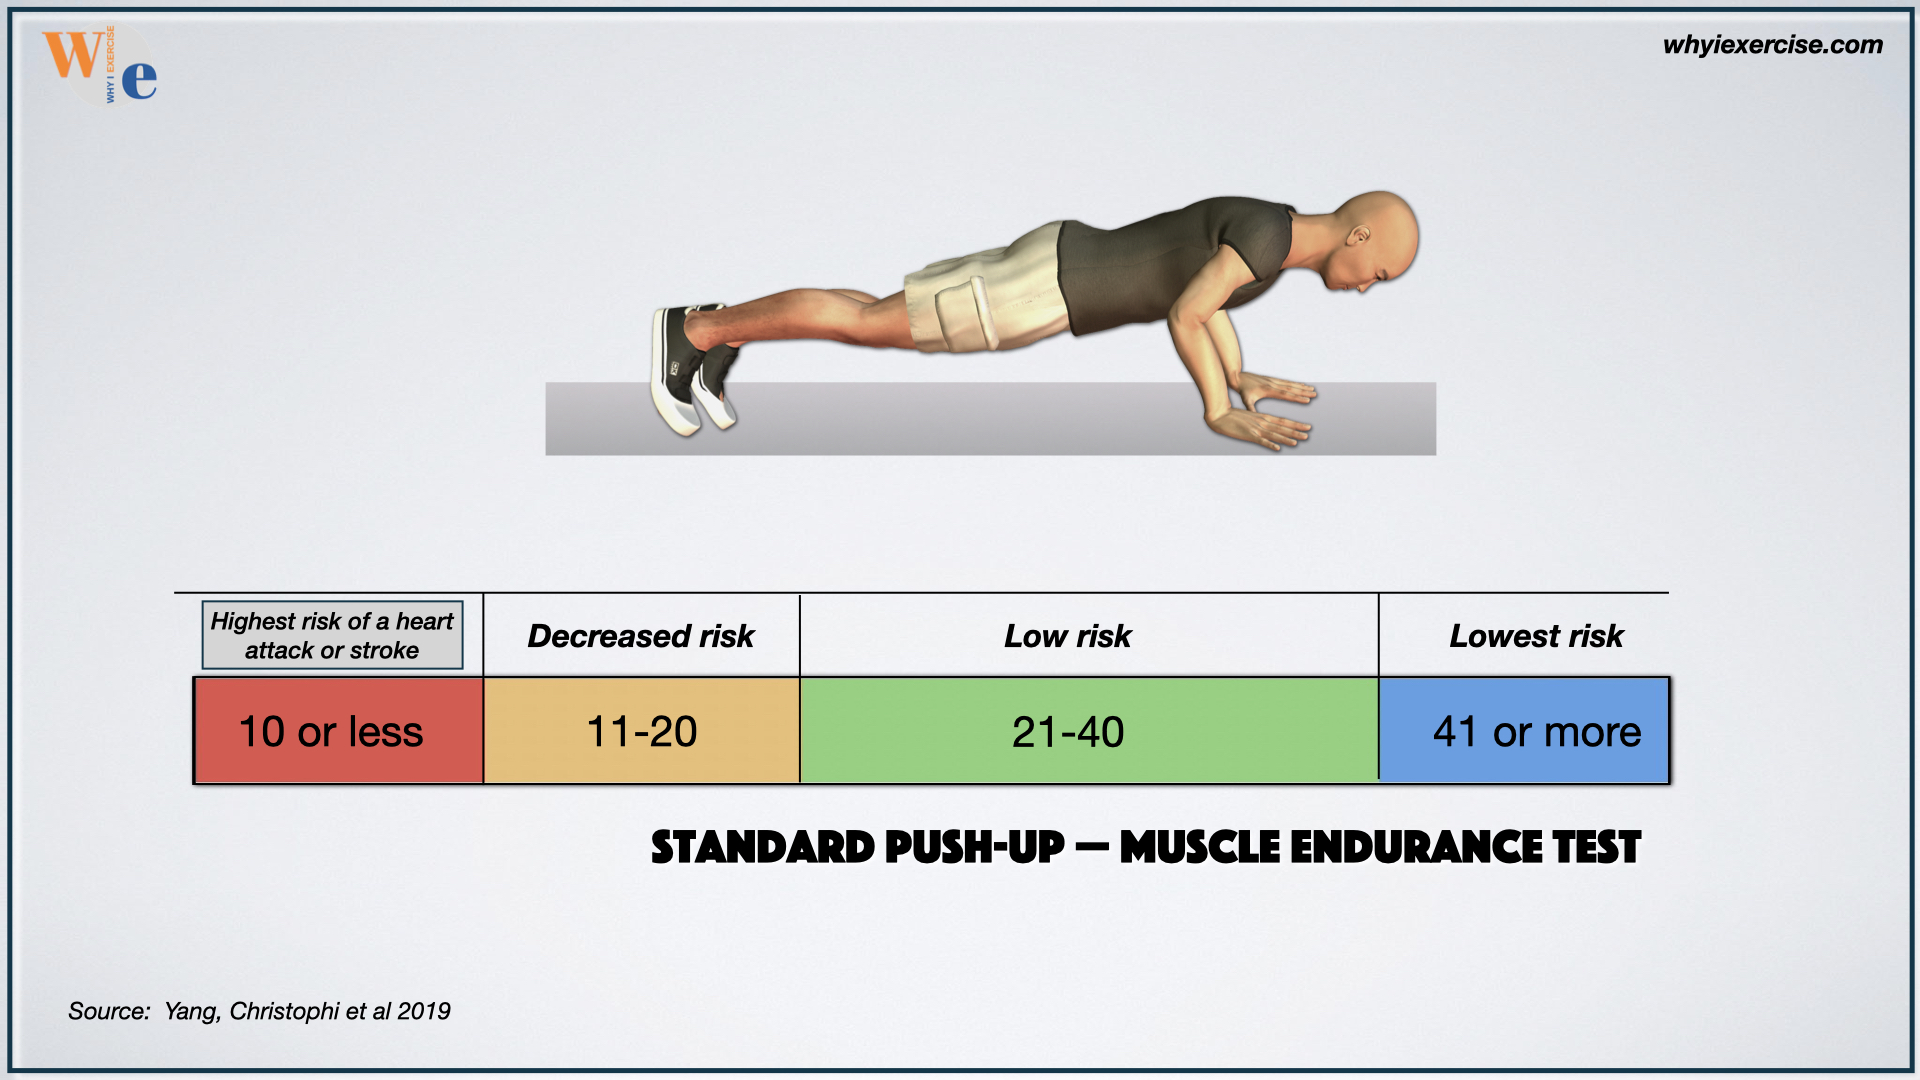 Men from this Harvard study who could do 41 push-ups or more were at the lowest level of risk (12).
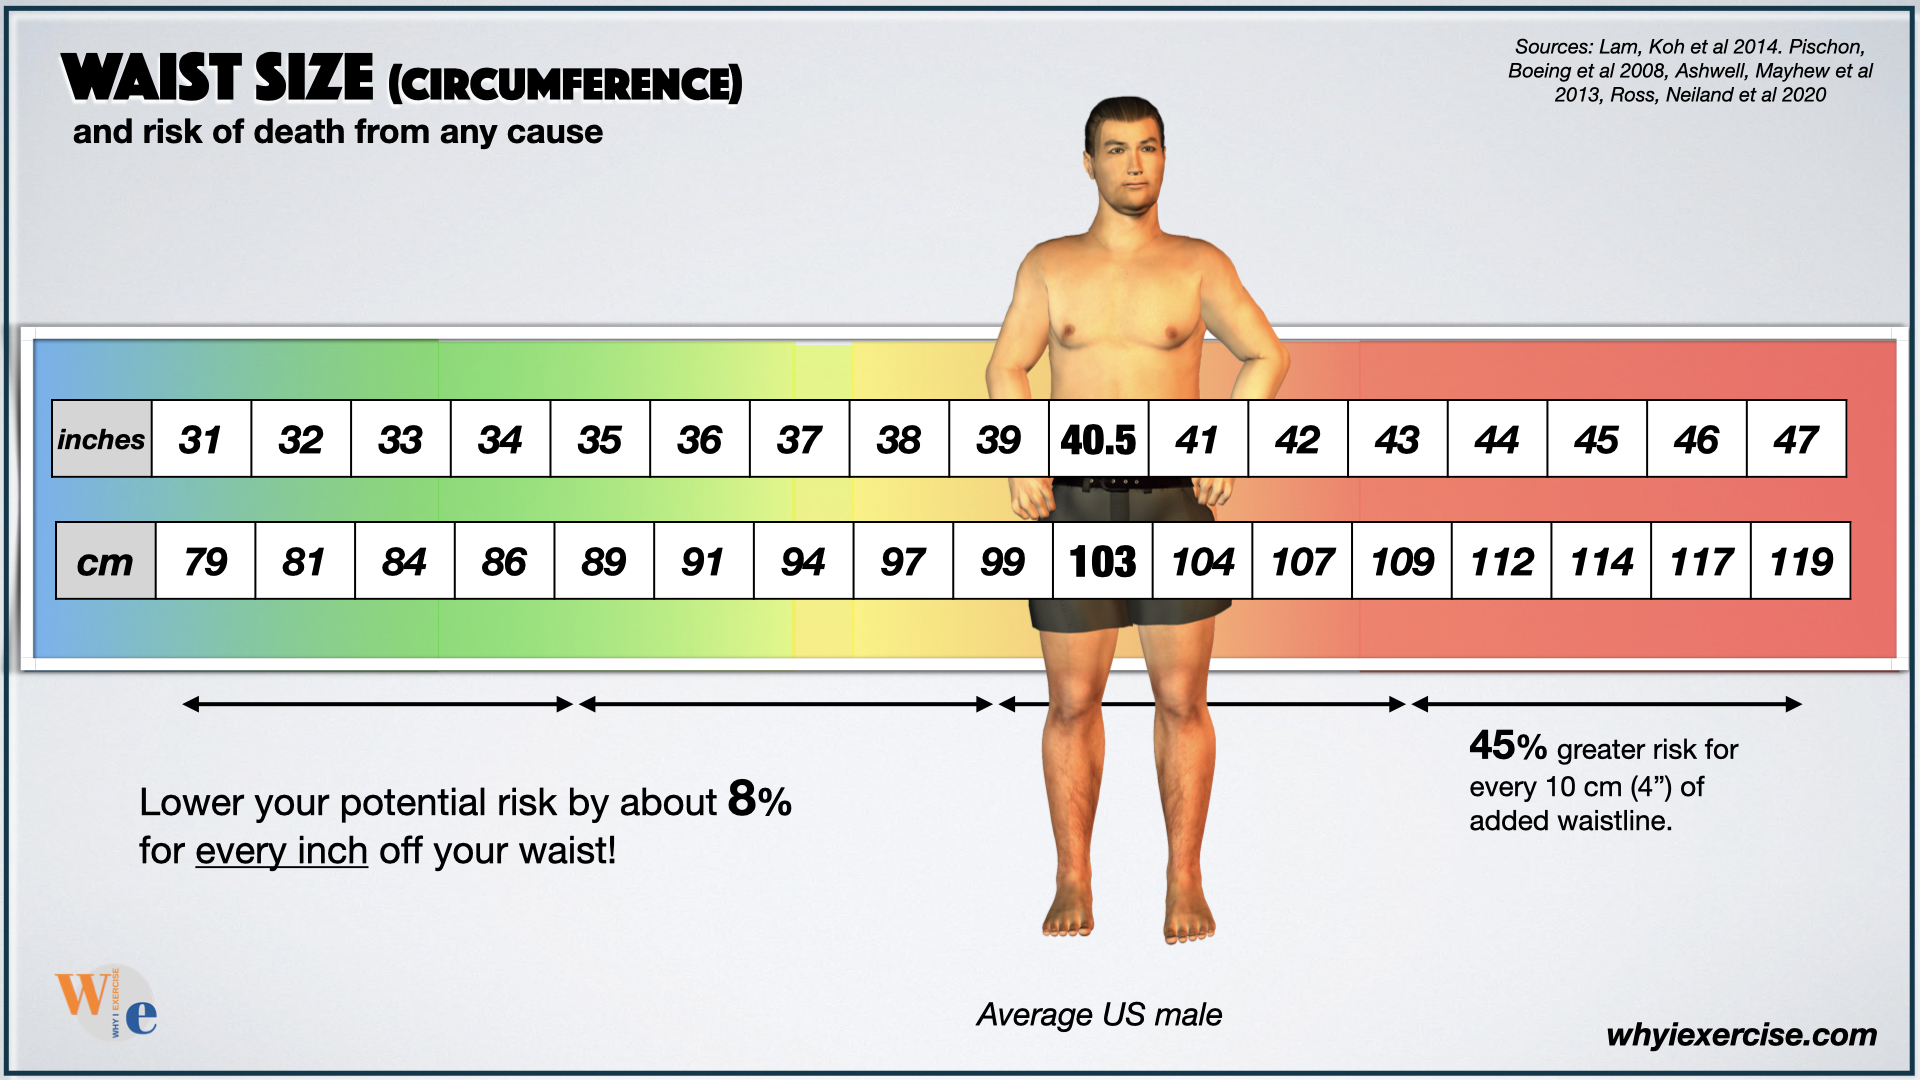 A smaller waist is associated with longer life expectancy, improved fitness, and lower risks of disease and death (13,14).
Excess weight and body fat can also affect your physical ability as you age. Scientists across the globe found that a waist measurement of less than half your height is a reliable minimum standard to help lower your health risks, regardless of body shape.
When used alongside these other tests, body mass index, a measure of your weight relative to your height, can be an insightful tool. A 2013 review of studies showed slower walking speeds and more trouble with balance in overweight and obese seniors, with similar results for seniors with increased waist measurements (16).
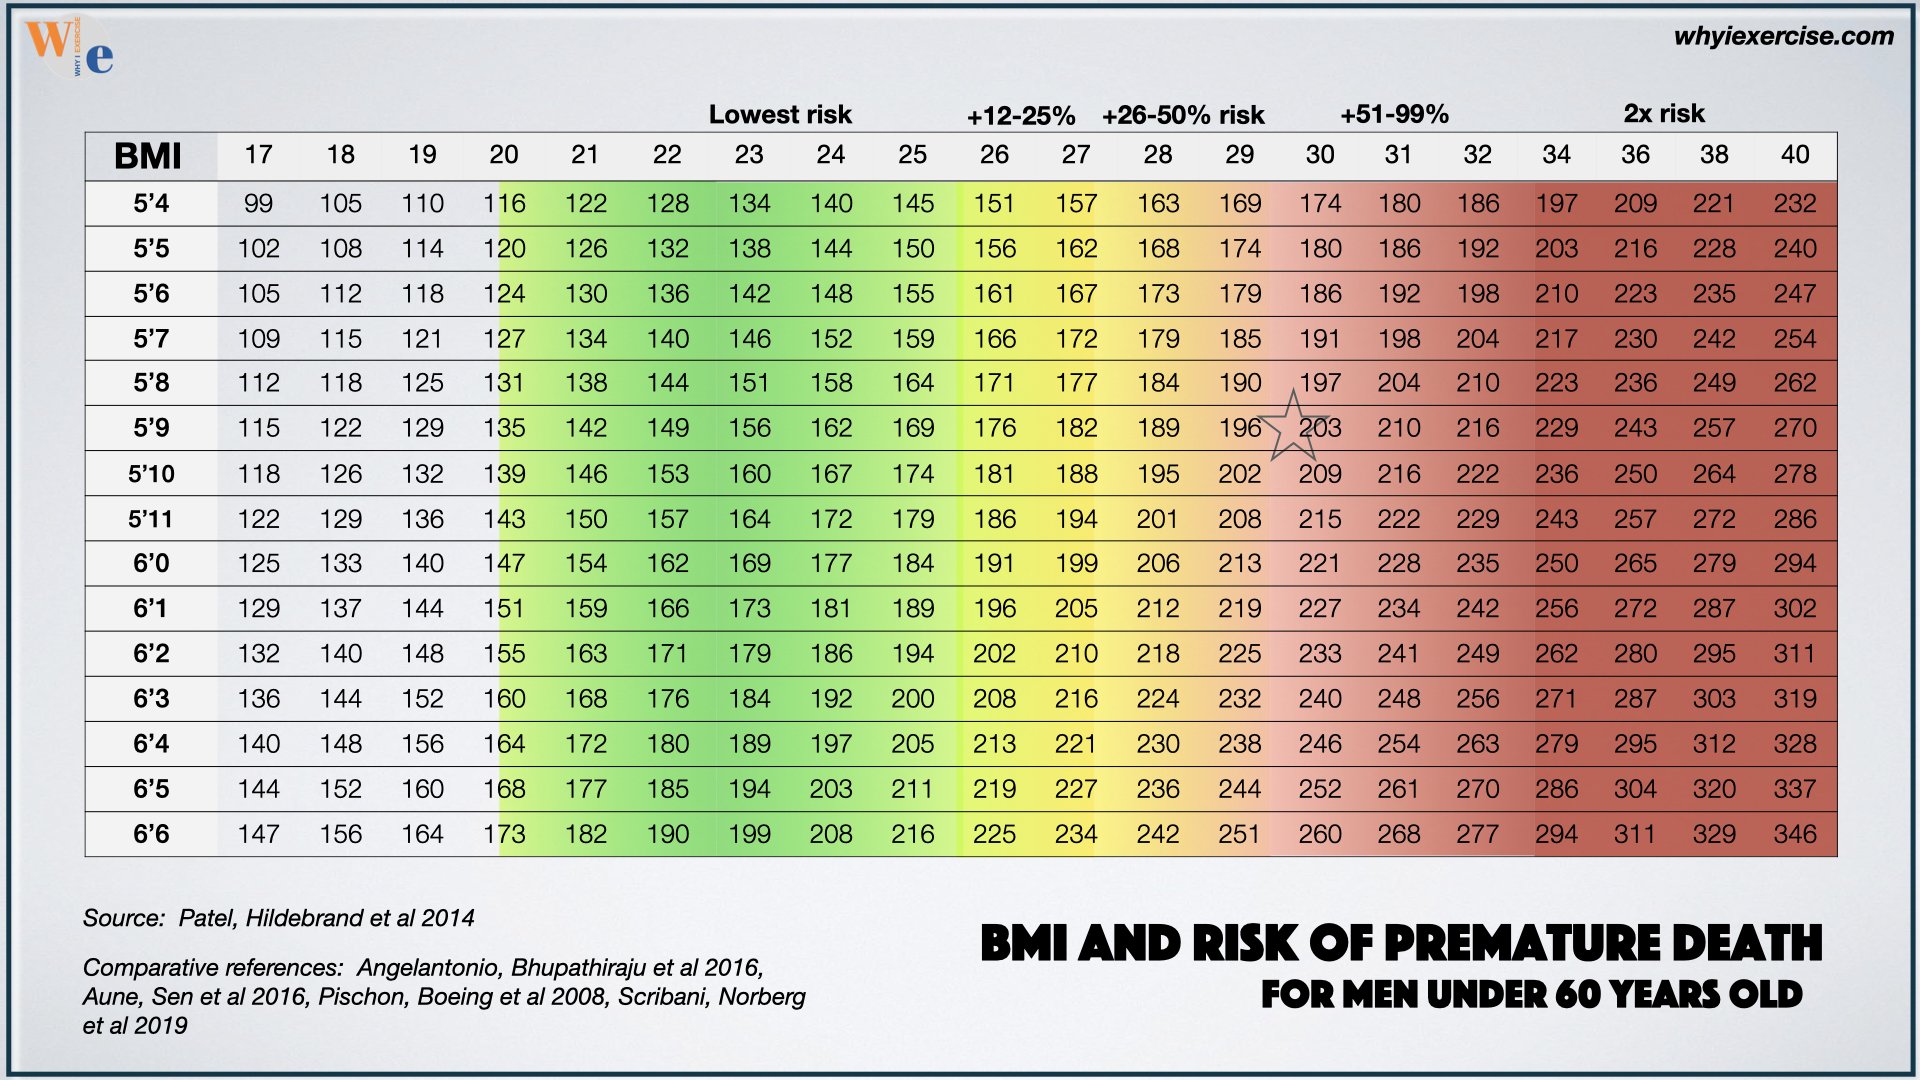
This weight chart for men under age 60 compares body mass index weight classes by their associated risk of premature death.
Healthy weight guidelines come from body mass index research that compares death, disease, and disability risk by weight class (15, 21, 22).
Conclusion
While age-related changes largely appear to be unavoidable, aging with exercise can make dramatic improvements in our heart health, strength, overall fitness, and quality of life. Visit the masterclass articles below to learn more about fitness tests that are proven health indicators, including VO2 max (cardio fitness), grip strength, and walking speed.
More Masterclass articles
VO2 max impacts our performance, our health, and even our survival! Learn how to test yourself accurately and find out whether you’re fit enough for optimal health and top performance.
This article describes the advantages of training your grip, showing the age-group strength standards you’ll want to match for better health and well-being. Test & develop your strength effectively using minimal equipment.
Seniors who walk faster live longer! Test your walking speed, build your strength, and improve your balance reactions for a faster walking pace.
Aging and Exercise References
1. Dodds RM, Syddall HE, Cooper R, Benzeval M, Deary IJ, et al. (2014) Grip Strength across the Life Course: Normative Data from Twelve British Studies. PLoS ONE 9(12): e113637. doi:10.1371/journal.pone.0113637
2. Landi F, Calvani R, et al. Normative values of muscle strength across ages in a 'real world' population: results from the longevity check-up 7+ project. J Cachexia Sarcopenia Muscle. 2020 Dec;11(6):1562-1569. doi: 10.1002/jcsm.12610. Epub 2020 Nov 4. PMID: 33147374; PMCID: PMC7749608.
3. Mandsager K, Harb S, Cremer P, Phelan D, Nissen SE, Jaber W. Association of Cardiorespiratory Fitness With Long-term Mortality Among Adults Undergoing Exercise Treadmill Testing. JAMA Netw Open. 2018;1(6):e183605. doi:10.1001/jamanetworkopen.2018.3605
4. Francis P, Lyons M, et al. Measurement of muscle health in aging. Biogerontology. 2017 Dec;18(6):901-911. doi: 10.1007/s10522-017-9697-5. Epub 2017 Apr 4. PMID: 28378095; PMCID: PMC5684284.
5. Mitchell WK, Williams J, et al. Sarcopenia, dynapenia, and the impact of advancing age on human skeletal muscle size and strength; a quantitative review. Front Physiol. 2012 Jul 11;3:260. doi: 10.3389/fphys.2012.00260. PMID: 22934016; PMCID: PMC3429036.
6. Kjær, I.G.H., Torstveit, M.K., Kolle, E. et al. Normative values for musculoskeletal- and neuromotor fitness in apparently healthy Norwegian adults and the association with obesity: a cross-sectional study. BMC Sports Sci Med Rehabil 8, 37 (2016). https://doi.org/10.1186/s13102-016-0059-4
7. Lohne-Seiler H, Kolle E, Anderssen SA, Hansen BH. Musculoskeletal fitness and balance in older individuals (65-85 years) and its association with steps per day: a cross sectional study. BMC Geriatr. 2016 Jan 12;16:6. doi: 10.1186/s12877-016-0188-3. PMID: 26755421; PMCID: PMC4709913.
8. United States Navy Physical Readiness Training Standards 2022 https://www.navy-prt.com/2022-navy-prt-standards/
9. Pasco, J.A., Stuart, A.L., Holloway-Kew, K.L. et al. Lower-limb muscle strength: normative data from an observational population-based study. BMC Musculoskelet Disord 21, 89 (2020). https://doi.org/10.1186/s12891-020-3098-7
10. Hoffmann MD, Colley RC, et al. Normative-referenced percentile values for physical fitness among Canadians. Health Rep. 2019 Oct 16;30(10):14-22. doi: 10.25318/82-003-x201901000002-eng. PMID: 31617933.
11. World Health Organization, The Global Health Observatory, Life expectancy at age 60; https://www.who.int/data/gho/data/indicators/indicator-details/GHO/life-expectancy-at-age-60-(years)
12. Yang J, Christophi CA, Farioli A, et al. Association Between Push-up Exercise Capacity and Future Cardiovascular Events Among Active Adult Men. JAMA Netw Open. 2019;2(2):e188341. doi:10.1001/jamanetworkopen.2018.8341
13. Ashwell M, Mayhew L, Richardson J, Rickayzen B (2014) Waist-to-Height Ratio Is More Predictive of Years of Life Lost than Body Mass Index. PLoS ONE 9(9): e103483. doi:10.1371/journal.pone.0103483
14. Lam BCC, Koh GCH, Chen C, Wong MTK, Fallows SJ (2015) Comparison of Body Mass Index (BMI), Body Adiposity Index (BAI), Waist Circumference (WC), Waist-To-Hip Ratio (WHR) and Waist-To-Height Ratio (WHtR) as Predictors of Cardiovascular Disease Risk Factors in an Adult Population in Singapore. PLoS ONE 10(4): e0122985. doi:10.1371/journal.pone.0122985
15. Patel AV, Hildebrand JS, Gapstur SM (2014) Body Mass Index and All-Cause Mortality in a Large Prospective Cohort of White and Black U.S. Adults. PLoS ONE 9(10): e109153. doi:10.1371/journal.pone.0109153
16. Hardy R, Cooper R, Aihie Sayer A, Ben-Shlomo Y, Cooper C, et al. (2013) Body Mass Index, Muscle Strength and Physical Performance in Older Adults from Eight Cohort Studies: The HALCyon Programme. PLoS ONE 8(2): e56483. doi:10.1371/journal.pone.0056483
17. Franceschi C, Garagnani P, Morsiani C, Conte M, Santoro A, Grignolio A, Monti D, Capri M and Salvioli S (2018) The Continuum of Aging and Age-Related Diseases: Common Mechanisms but Different Rates. Front. Med. 5:61. doi: 10.3389/fmed.2018.00061
18. Gonzalez-Freire M, de Cabo R, Studenski SA, Ferrucci L. The Neuromuscular Junction: Aging at the Crossroad between Nerves and Muscle. Front Aging Neurosci. 2014 Aug 11;6:208. doi: 10.3389/fnagi.2014.00208. PMID: 25157231; PMCID: PMC4127816.
19. Khan SS, Singer BD, Vaughan DE. Molecular and physiological manifestations and measurement of aging in humans. Aging Cell. 2017 Aug;16(4):624-633. doi: 10.1111/acel.12601. Epub 2017 May 23. PMID: 28544158; PMCID: PMC5506433.
20. Jakovljevic, DG. Physical activity and cardiovascular aging: Physiological and molecular insights, Experimental Gerontology, Volume 109, 2018, Pages 67-74, ISSN 0531-5565, https://doi.org/10.1016/j.exger.2017.05.016.
21. Kivimäki M, Strandberg T, et al. Body-mass index and risk of obesity-related complex multimorbidity: an observational multicohort study. Lancet Diabetes Endocrinol. 2022 Apr;10(4):253-263. doi: 10.1016/S2213-8587(22)00033-X. Epub 2022 Mar 4. PMID: 35248171; PMCID: PMC8938400.
22. Supplement to: Kivimäki M, Strandberg T, Pentti J, et al. Body-mass index and risk of obesity-related complex multimorbidity: an observational multicohort study. Lancet Diabetes Endocrinol 2022; published online March 3. https://doi.org/10.1016/ S2213-8587(22)00033-X.
